Hi, how to create a margin for data that are comes from API?Or how to move data from the begining of the page ?
Hi, how to create a margin for data that are comes from API?Or how to move data from the begining of the page ?
Hi the report is generating correctly but the file doesn't want to download it :(
what is the problem ?
 <button type="button" onclick="downloadPDF()">Pobierz</button>
 <script src="https://unpkg.com/@jsreport/browser-client/dist/jsreport.umd.js"></script>
 jsreport.serverUrl = 'http://localhost:5488/'
function downloadPDF() {

        jsreport.render({
            'template': {
                'shortid': 'Ngmy7zdGi',
	            'recipe': 'chrome-pdf'
            },
			"options": {
		        	"reports": { "async": true }
				}
           });
		   jsreport.download({ 'shortid': 'Ngmy7zdGi'});
    }
formatDate is my function to print formated date,
I'm trying to put in one array in object like this :
<script>
{{#each store.data}}
const reportData= {
data1: ['{{formatDate timeStamp}}'],
wartosc: [{{round value}}]
};
{{/each}}
const ctx = document.getElementById('myChart');
const myChart = new Chart(ctx, {
type: 'bar',
data: {
labels: reportData.data1,
datasets: [{
label: "Wartość [m3]",
data: reportData.wartosc,
backgroundColor: [
'rgba(54, 162, 235, 0.2)',
'rgba(54, 182, 29935, 0.2)',
],
borderColor: [
'rgba(54, 162, 235, 1)'
],
borderWidth: 1
}]
},
options: {
scales: {
y: {
beginAtZero: true
}
}
}
});
</script>
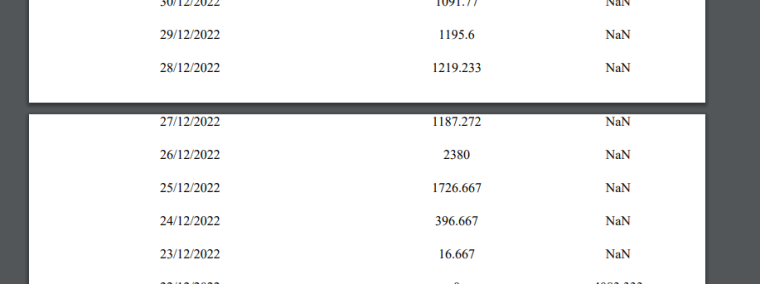
And I'm geting something like that:
<script>
const reportData= {
data1:['2022-08-17'],
wartosc: [1.757]
};
const reportData= {
data1:['2022-08-23'],
wartosc: [0.451]
};
const reportData= {
data1:['2022-08-29'],
wartosc: [0.345]
};
const reportData= {
data1:['2022-08-30'],
wartosc: [1.236]
};
const reportData= {
data1:['2022-08-31'],
wartosc: [0.659]
};
const reportData= {
data1:['2022-09-01'],
wartosc: [0]
};
const reportData= {
data1:['2022-09-14'],
wartosc: [0.706]
};
const reportData= {
data1:['2022-09-15'],
wartosc: [0]
};
const reportData= {
data1:['2022-09-18'],
wartosc: [2.27]
};
const reportData= {
data1:['2022-09-19'],
wartosc: [0.565]
};
const reportData= {
data1:['2022-09-20'],
wartosc: [0.756]
};
const reportData= {
data1:['2022-09-21'],
wartosc: [0.874]
};
const reportData= {
data1:['2022-09-22'],
wartosc: [0]
};
const reportData= {
data1:['2022-09-25'],
wartosc: [0.1]
};
const reportData= {
data1:['2022-09-26'],
wartosc: [1.154]
};
const reportData= {
data1:['2022-09-27'],
wartosc: [0.841]
};
const reportData= {
data1:['2022-09-28'],
wartosc: [0.389]
};
const ctx = document.getElementById('myChart');
const myChart = new Chart(ctx, {
type: 'bar',
data: {
labels: reportData.data1,
datasets: [{
label: "Wartość [m3]",
data: reportData,
backgroundColor: [
'rgba(54, 162, 235, 0.2)',
'rgba(54, 182, 29935, 0.2)',
],
borderColor: [
'rgba(54, 162, 235, 1)'
],
borderWidth: 1
}]
},
options: {
scales: {
y: {
beginAtZero: true
}
}
}
});
</script>
Hi, I tryed to put some data do chart js in pdf template, should I use something else?
  <canvas id="myChart" width="400" height="400"></canvas>
<script>
var labels = [{{#each store.data}}{{formatDate timeStamp}}{{/each}}];
var value = [{{#each store.data}}{{round value}}{{/each}}];

cument.getElementById('myChart');
const myChart = new Chart(ctx, {
    type: 'bar',
    data: {
        labels: labels,
        datasets: [{
            label: 'Wartość [m3]',
            data: value,
            backgroundColor: [
                'rgba(54, 162, 235, 0.2)',
            ],
            borderColor: [
                'rgba(54, 162, 235, 1)'

            ],
            borderWidth: 1
        }]
    },
    options: {
        scales: {
            y: {
                beginAtZero: true
            }
        }
    }
});
</script>
ok you can check my project
https://playground.jsreport.net/w/AqMarek/PGH98xD3
or I wrong use {{#each store.data}}{{formatDate timeStamp}}{{round value}}{{/each} in the table
It's look like chart in xlsx doesn't suport the handelbars snipet