v3 jsreport monitoring
-
A few questions about the "monitoring" cpu / memory of the server jsreport is running on.
- Is the monitoring data stored indefinitely?
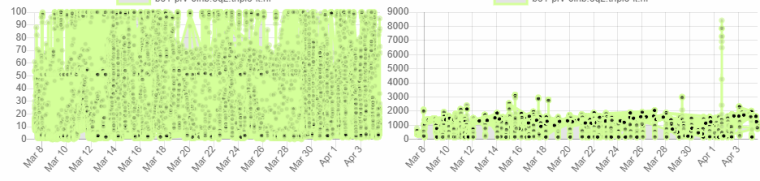
- Rendering the monitoring data takes quite a while and I personally don't find the graphs that useful, is it supposed to be like this?
one of our test machine (1 node)

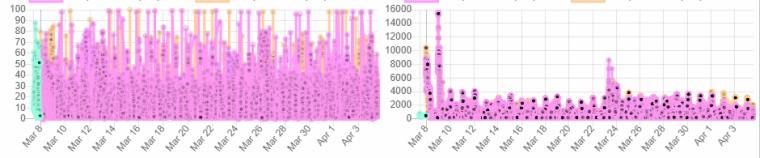
on our production machines (3 nodes)

-
Ouch, that looks bad. We will make sure to have this improved in the next release.
You can just remove thedata/monitoringfile now or drop the monitoring collection (table).Do you have some ideas about what would you like to see on the startup page?
These charts apparently need better handling for granularity and cleanup.
But, does this information has any value for you? Would you like to see something else?
-
We don't use jsreport for monitoring the server and it just slows down the startup page. So no it has no value to us.
I would make it an optional feature or remove it and keep jsreport just for templating. We use a dedicated solution for monitoring our servers currently: https://checkmk.com/
On the startup page i do like:
- open profiler button
- last requests' profiles
- last edited templates
I also like these graphs, but the graphs are also a bit wonky due the time range of just 1 minute
- render requests status
- render requests durations
in v2 there was also a section for the last 5 failed requests, which would be nice. But i know i can see it in the profiler
-
Thank you. See how we have changed the Startup page based on your suggestions.
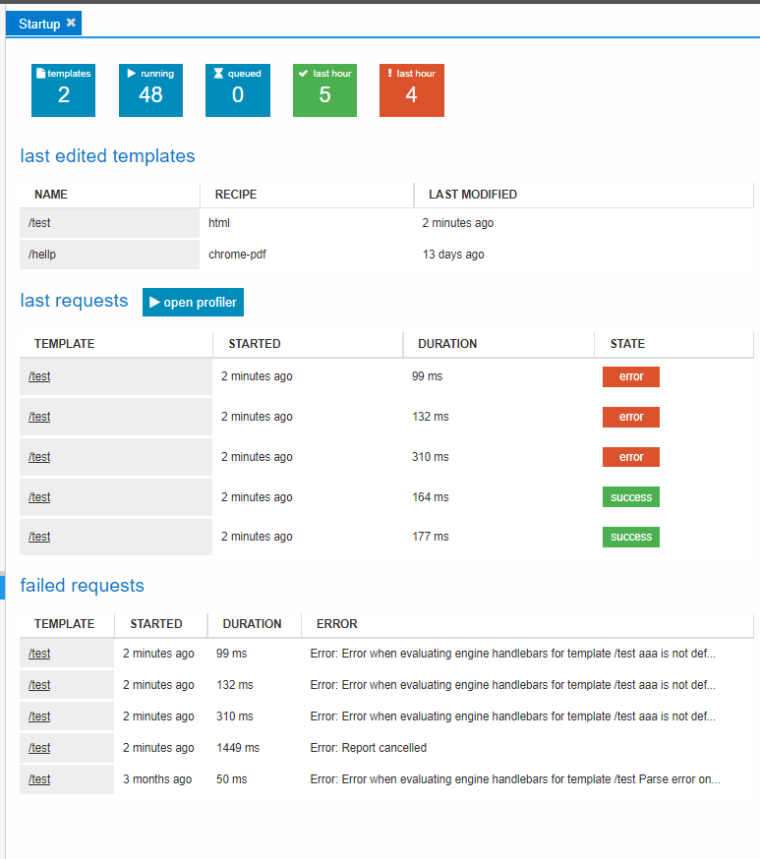
We should ship it the next release if no other ideas pop up till then.
-
I do like this startup page :)
Is it possible to change the "last hour" time of green/red blocks in the config? I think I would like to configure it to like 24 hours or 1 week.
-
The thing is that we query this information from the stored profiles history.
And by default, we keep like 1000 profiles in the history.
In other words, if you render in 1 week 10k reports, the value showing successful requests would be just ~1000 because the history wouldn't keep all the 10k.
So the "last hour" is there to provide "the most meaningful information".
Will have to make up my mind about this problem, and maybe introduce some extra counters in the db.
-
ok I understand, we are currently rendering about 960.000 templates per month, averaging about 32.000 per dag. Would this also work with the "last hour"?
