Extremely high memory usage causing workers to frequently crash
-
Environment
- We are currently running JS Report on a Windows 2019 server, with 8GB memory.
- Node is allowed to use heap size up to 4GB.
- We are running JS report as a windows service.
- JS report is configured to use 4 service workers. We're using Node version 18.16.0.
- JS Report is the only service/program running on this VM, aside from Windows itself.
- We're on the latest version of JS Report.
Problem Scenario
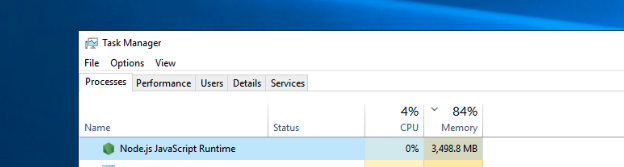
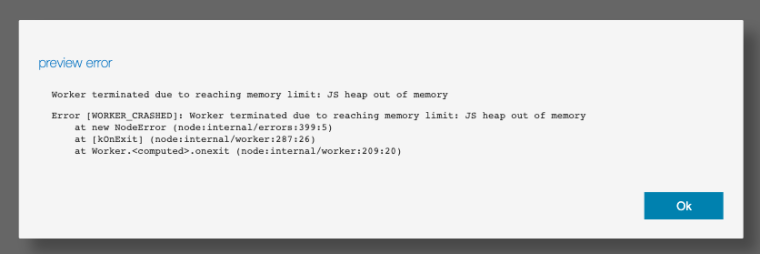
We are rendering anywhere from 1 to 500 Chrome-PDF based recipes one after the other, and are frequently experiencing instances where service workers crash due to being out of memory (see below message). When checking memory usage, the Node process used by JS Report is typically using 75% of the available memory, even when JS Report is not actively rendering.
A typically example of how our JS Report template is structured:
- A handlebars file is connected to one or more script files
- the script files source data by making calls to external API's, or the connect directly to an external database and make a SQL request
- we are not connecting to a data source aside from external API's or SQL requests
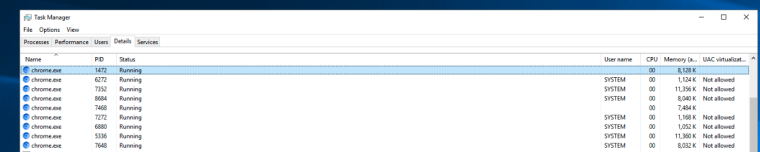
In trying to debug, we noticed there are a high number of Chrome.exe's running in the background, even when no reports are being generated. These chrome.exe's are accounting for the majority of memory usage by JS report. These Chrome.exe instances appear to spawn when a report is being actively generated, but they don't always terminate after the report finishes.
We've noticed that manually terminating those Chrome.exe instances does not reduce Node's memory usage, but when we restart the JS Report instance, Node Memory usage drops back down to acceptable levels.
Question
In what cases would JS Report leave Chrome.exe instances running after a report is finished? Any other type of suggestions to get useful debug info?
Example of high memory usage, even though there are no reports being generated
Example of report failure due to service worker crash
Example of numerous Chrome.exe instances running in background, even though no reports are currently being generated
-
There were some memory leaks fixed recently. Could you use the latest 3.12.0? This could help with the nodejs memory consumption. However, nodejs is quite lazy with releasing memory and often uses all what you provide for some time before it starts GC.
Regarding chrome instances...
In v3, the default strategy is to keep chrome instance running per worker to avoid starting it over and over.
Chrome in background keeps some additional processes running so in case of one worker, you get anyway 3 chrome processes running.
You can configure jsreport to start individual chrome for every request (strategy = dedicated-process)
https://jsreport.net/learn/chrome-pdf#chrome-process-allocationCould you please also try the same locally? Do you observe the same issues? Just to eliminate the windows server.
Do you deploy as a windows service running node orjsreport.exe? How do you trigger rendering, using HTTP API call?
-
Thanks Jan,
- we've updated to 3.12, we were previously on 3.5
- we are deploying as windows service using the jsreport win-install method, per your docs
- Yes, we trigger rendering using the web API
We will continue to do some testing and let you know our findings.
