Long Report Performance
-
Problem
I was wondering if long reports should take about 20 minutes at times? I run into timeout issues every now and then and was wondering if there was anything else I can do to make them render a bit faster or if this is the law of the land. Could you tell me if I'm doing something wrong with my templates, data aggregation or just doing something weird with jsreports? I'm using a slightly modified configuration from the long reports description.
I'm using
jsreport: 2.3.0{ "httpPort": 5488, "allowLocalFilesAccess": true, "store": { "provider": "fs" }, "assets": { "allowedFiles": "**/**.png" }, "blobStorage": { "provider": "fs" }, "templatingEngines": { "timeout": 1000000, "strategy": "in-process", "numberOfWorkers" : 16, "forkOptions": { "execArgv": ["--max-old-space-size=4096"] } }, "chrome": { "timeout": 1000000 }, "tasks": { "timeout": 1000000 }, "extensions": { "sample-template": { "createSamples": true }, "scripts": { "timeout": 1000000 }, "express": { "renderTimeout": 1000000, "inputRequestLimit": "800mb" } } }
-
That is a giant workspace in playgound :).
Could you please paste the debug logs from your environment, so we know at which part the rendering takes the most of the time?
-
Too long to post. I'll get a successful one to render if it will help more but this is a little over 16 minutes. I was assuming the file permission thing wasn't a concern. Yeah.. the work space is kind of big. Let me know if you need that still. I can also upload the export if that helps.
-
Too long to post
I mean you run the template with "debug" button in studio and paste the output here. It shouldn't be long.
-
The debug log is also too long.
https://www.dropbox.com/s/rbqm81ce4p6tmwh/jsreport-debug-log.log?dl=0
-
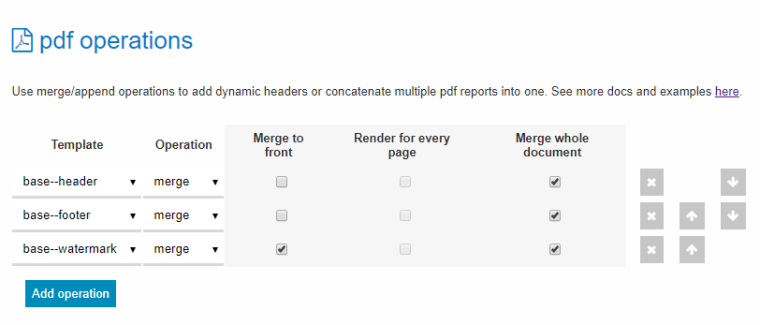
It seems you render headers using pdf utils and you use default merge which runs individually for every page.
Try using the "merge whole document" featurehttps://jsreport.net/learn/pdf-utils#merge
https://playground.jsreport.net/w/admin/Wy6stA8t
-
@jan_blaha I'm using Merge Whole Document currently / in the example I've sent
-
Hm. So how it comes the log includes 436 child rendering requests.
These can come from the pdf utils or from the child templates.
Do you use child templates somehow extensively?
Do you have a valid reason for it? The assets are usually faster if you don't need something dynamic there.
-
Ah, I use child templates almost exclusivly. Is there a better way to achieve the description below? I wanted to make adding new sections contained and automated with using the right naming convention.
Currently what I'm doing is I create a base template file that loops through the sections. It then does the followng:
- Page break before every section so that sections don't overflow into another section.
- Set section header dynamically from section header value.
- Insert a child template based on the section name.
- If I pass the section with a name 'some-name', it will go and pull the same named child template 'some-name.html'.
- I also pass the section name / report type into the child template so that when I'm inside the template I can loop through the sections and access the correct section from the data I passed to the report.
The different reports I'm generating all follow the same pattern and layout so I don't need to create a bunch of chrome-pdf templates. The base-template is just there for rendering the child templates. Whenever people add new sections they only need to worry about adding one file.
File structure
root
    research folder
        section1-name (child-template)
        section2-name (child-template)
        section3-name (child-template)
    base-report (chrome pdf template)
Data object
{
    sections: [
        name: 'some-name',
        header: 'Some Name',
        ...,
        subSections: [
            {
                name: 'some-name',
                header: 'Some Name',
                ...
            }
        ]
    ]
}
Base report chrome-pdf template
{{#each report.Sections}}
    <div style='page-break-before: always;'></div>
        {{#if Header}}
            <div class="hide-data">{{{pdfCreatePagesGroup Header}}}</div>
        {{/if}}
        {{#if ../report.ReportType}}
            {{{insertChildTemplate null Name 8}}}
        {{else}}
            {{{insertChildTemplate ../report.ResourceName Name 8}}}
        {{/if}}
    {{/if}}
{{/each}}
Child-template
{{#with (lookup report.Sections parentIndex)}}
    ...
{{/with}}
-
Hm. Quite complex case.
Looking again at the logs it seems it spends like 10minutes just rendering html using child templates. That is a lot.
There are some strange gaps when nothing is happening. Like node starts to swap or something.+23419 Resources not defined for this template. +56676 Replaced assetsCould you please email me the export and tell me which template to run. I will try to find time to dig deeper.
-
Thanks for sending the export.
I see your report produces 120MB html which chrome tries to convert to pdf.
We could eventually optimize the performance for generating html, however we can't optimize converting 120MB html in chrome.
Such task can take very very long time.I am not sure how you can proceed now. How many pages do you expect this report prints out? Is it actually reasonable to generate something so big?
Can't you split it into multiple pdfs? Although, I understand it is hard to break business requirements.
-
Thank you very much for taking a more in depth look! Unfortunately we have clients who do want to be able to generate reports with potentially 800-1200 pages of pretty detailed insights and do not want them to be split into multiple pdfs. We're going to be adding a batch/que system to offset the heavy load times but wanted to double check there wasn't somewhere I could shave off some minutes during generation.
Was hoping that I was using child templates / assets wrong and was doing something unnecessary to cause the load time.
-
I see...
I didn't analyze deeper how you use child templates or assets, because it is not so important to optimize here if the chrome takes the most of the time anyway.
1000 pages are so much that optimizing somewhere else than in the output html is probably irrelevant.We have now in backlog task that could eventually give you a way how to speed the chrome printing.
https://github.com/jsreport/jsreport/issues/490#issuecomment-471622799
You can subscribe and get a notification when it starts moving.
