High storage traffic volume
-
A few days ago I follow the following blogpost on running JsReport in a container on azure. (Latest full version, I think it was 2.6.0) https://jsreport.net/blog/render-reports-using-azure-app-service
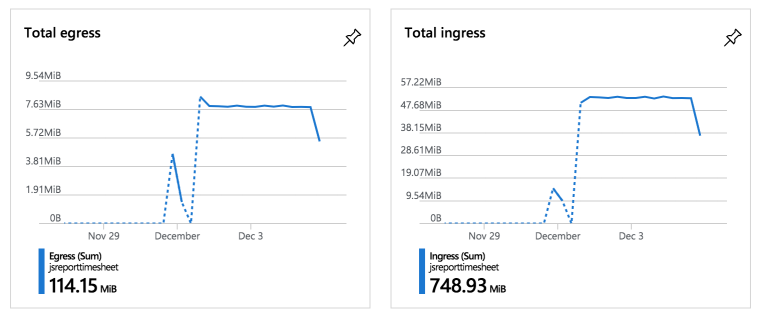
It is been running for almost four days now and the Azure Portal shows that the traffic to the blob storage is almost 1Gb now.
I haven't been doing much, so 1GB seems like a lot to me. Is this a bug or is there any way to reduce this?
-
So it is like 748MB / (4days) / 24(hours) ~= 8MB per hour ?
What are you doing with the service? Could you share output logs?
Don't you have some schedules running?Maybe it helps to disable jsreport studio logs persistence in the storage using this config.
extensions.studio.requestLogEnabled=false
-
Well, the first day I did some experimenting. Created a template, ran it a couple of times and used the api. I assume that is why there is a small spike in the egress. The other day it did literally nothing. Maybe logged on to the jsreport portal.
AFAIK there are no schedules running. Unless default schedules are created?
Do I need to enter the container shell to disable the logging or can I do it from the azure portal the same way I set the admin password?
-
The same way. All configurations can be set using environment variables.
-
There are no default schedules.
Thinking if there is another logic running in the interval, and it could help to set a high value also to this config.extensions_fsStore_compactionInterval=600000
To correct the previously mentioned env var, it should be like this
extensions_studio_requestLogEnabled=false
-
Thanks! I just set the values and I'll check it in 24 hours.
-
Is disabled the logs and increased the interval to a day. The data volume is a now a tenth. Thanks!
