Report is never generated
-
I need to wait for the google map to be drawn, so I started using waiting for printing trigger
If I test it separately or put the maps at the beginning of the html, it works great, but the maps must be inserted at the end of the page, which doesn't work.

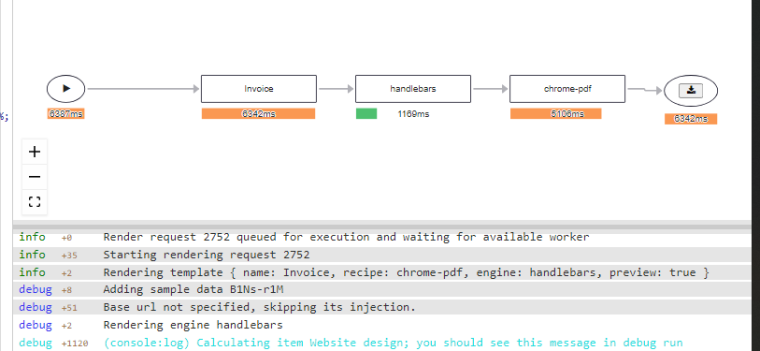
it is locked as shown in the image above
I would like to know if anyone has any idea why it doesn't generate the report if placed at the end of the page.
Note: my report must have more than 3k lines, if I place a loop that generates the map between the first 0-300 lines, everything works as it should, if placed after these +/-300 lines it simply gets stuck.
-
There are no errors in the profile logs?
-
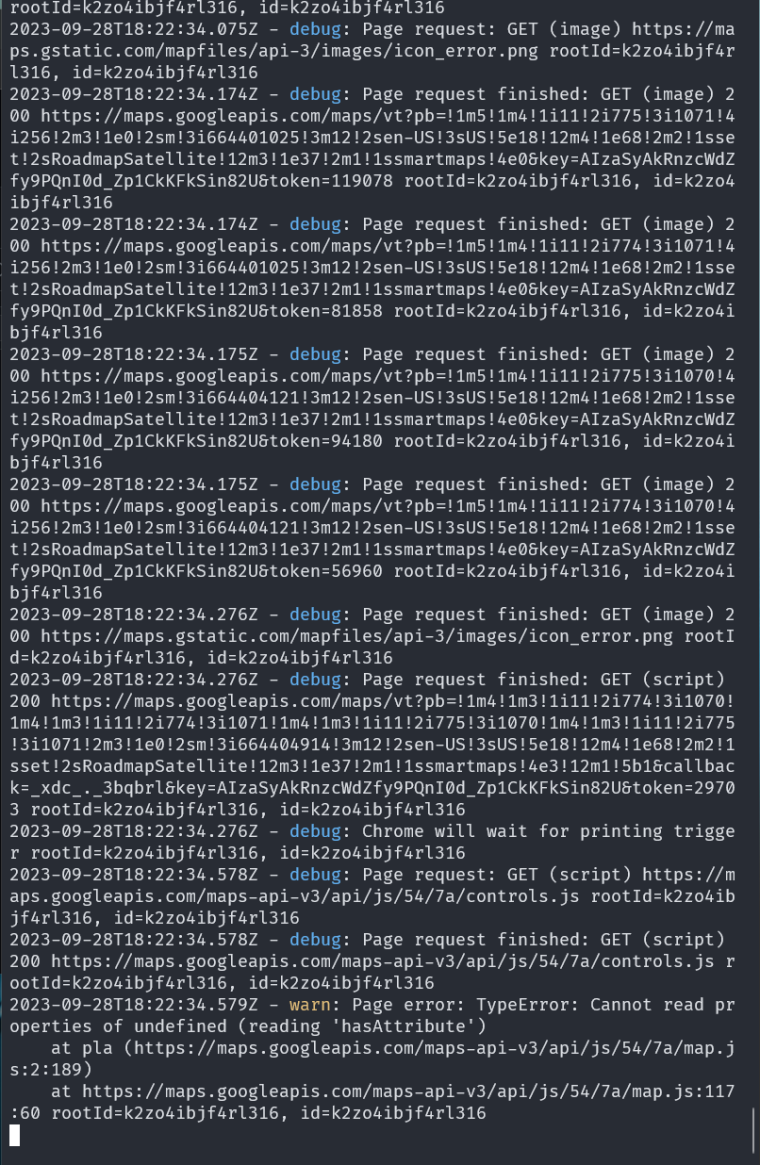
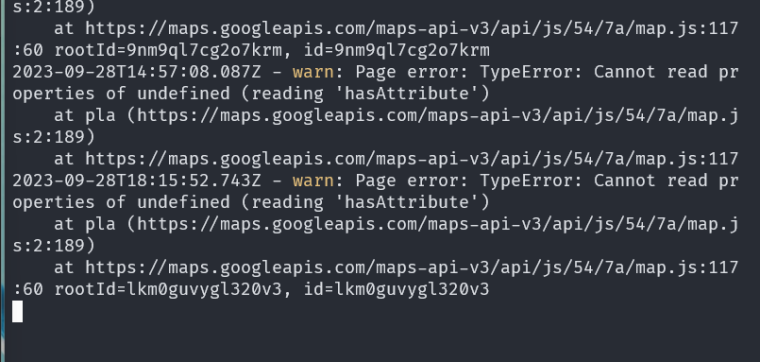
would it be this?
-
If not, how do I manage to have a good log of what is happening?
-
Yes, you can take logs from stdout, log files or from the bottom panel in the profile tab
As I see from your image, there is a javascript error on your page which you should focus on. It can break the map rendering.
Page error: TypeError: cannot read properties of undefined
-

How do I get full access?
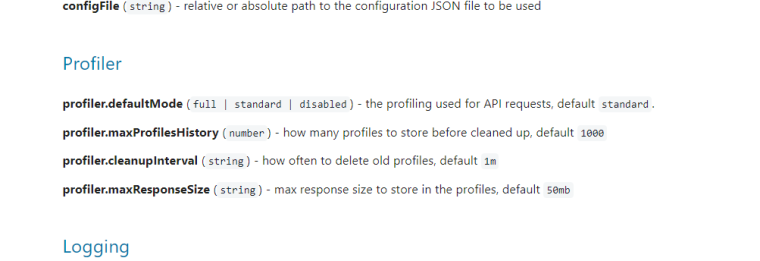
I even found the doc, but I didn't understand how to use it
-
I actually don't understand where I apply this config
-
If you want to run with full profiling a particular request, you can use the following button
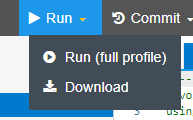
If you want to switch to "full profiling" all reports using studio, use the following
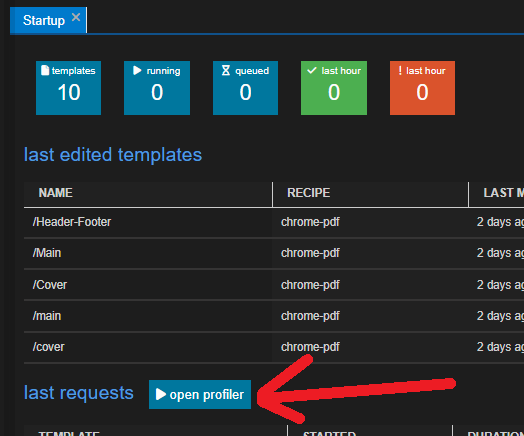

You can also manage the default mode using server config https://jsreport.net/learn/configuration
So for example openjsreport.config.jsonand add there a value{ ... "profiler": { "defaultMode": "full" } }
-

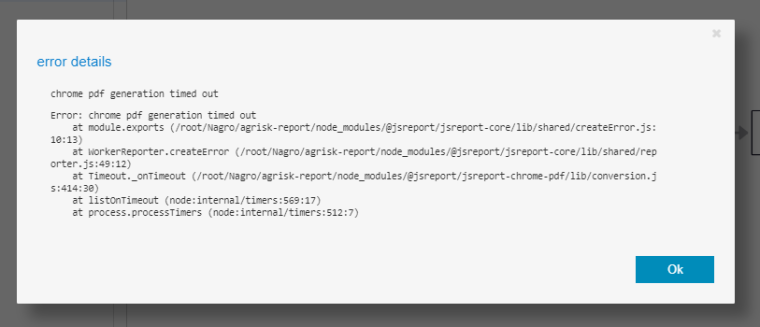
it does not generate this log file
-
this is my configuration file, is there anything I should adjust here?
{
  "httpPort": 5488,
  "store": {
    "provider": "fs"
  },
  "blobStorage": {
    "provider": "fs"
  },
  "logger": {
    "console": {
      "transport": "console",
      "level": "debug"
    },
    "file": {
      "transport": "file",
      "level": "info",
      "filename": "logs/reporter.log"
    },
    "error": {
      "transport": "file",
      "level": "error",
      "filename": "logs/error.log"
    }
  },
  "trustUserCode": true,
  "reportTimeout": 900000,
  "templatingEngines": {
    "strategy": "dedicated-process"
  },
  "extensions": {
    "child-templates": {
      "parallelLimit": 5
    },
    "authentication": {
      "cookieSession": {},
      "admin": {
        "username": "admin",
        "password": "password"
      },
      "enabled": false
    },
    "sample-template": {
      "createSamples": true
    },
    "scripts": {
      "strategy": "http-server"
    }
  },
  "chrome": {
    "launchOptions": {
      "args": ["--no-sandbox"]
    }
  }
}
-
it does not generate this log file
I'm not sure what you are asking. The timeout could occur because you didn't fire the printing trigger. Maybe because of some js errors on your page.
-
my problem is that it doesn't generate the report depending on where I place this component
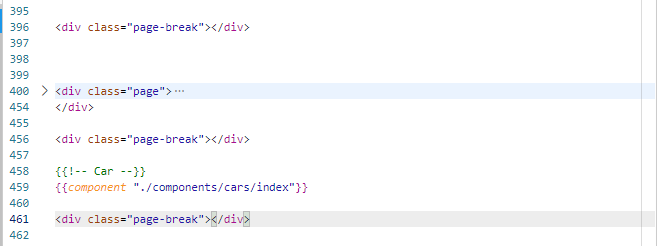
below line 458 it doesn't work
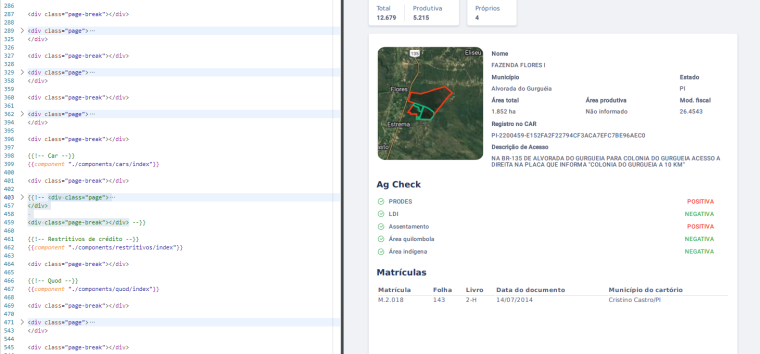
Now, if placed above, it works normally
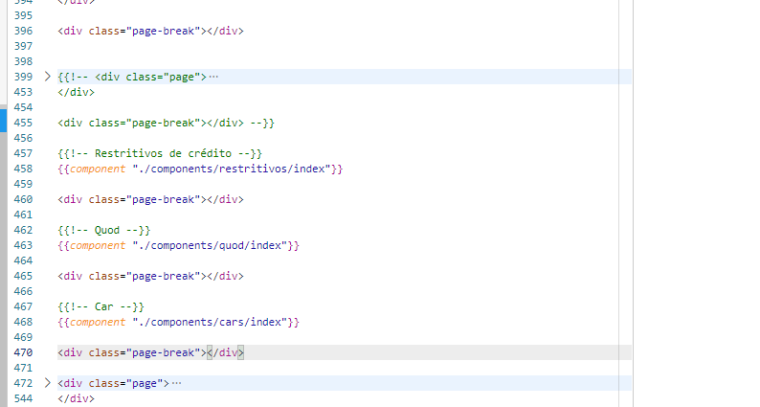
In this last print I even commented on the code that came before it and threw the component below others, to show that the problem is where it is called in the code.
-
The component can add a script that breaks the rest of the js on the page...
Would you be able to provide a playground demo replicating the issue?