Duration column in Profiler page
-
Hello, I want to ask about the profiler page.
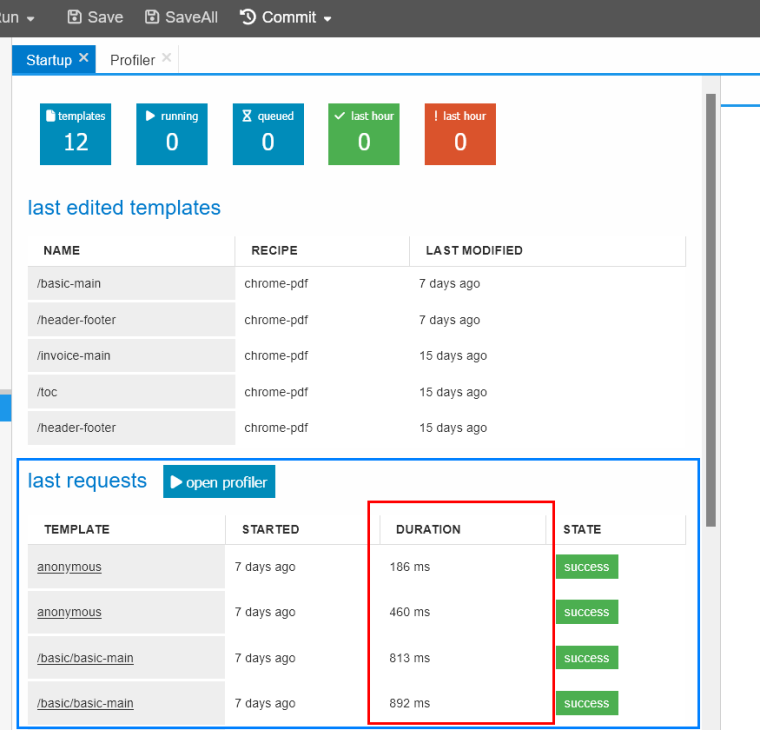
In the home/startup page, in the last requests section, there is a duration column which is helpful to measure how long it took for jsreport to render a template. But the requests page only shows a few of the latest request, so it's not a complete history.

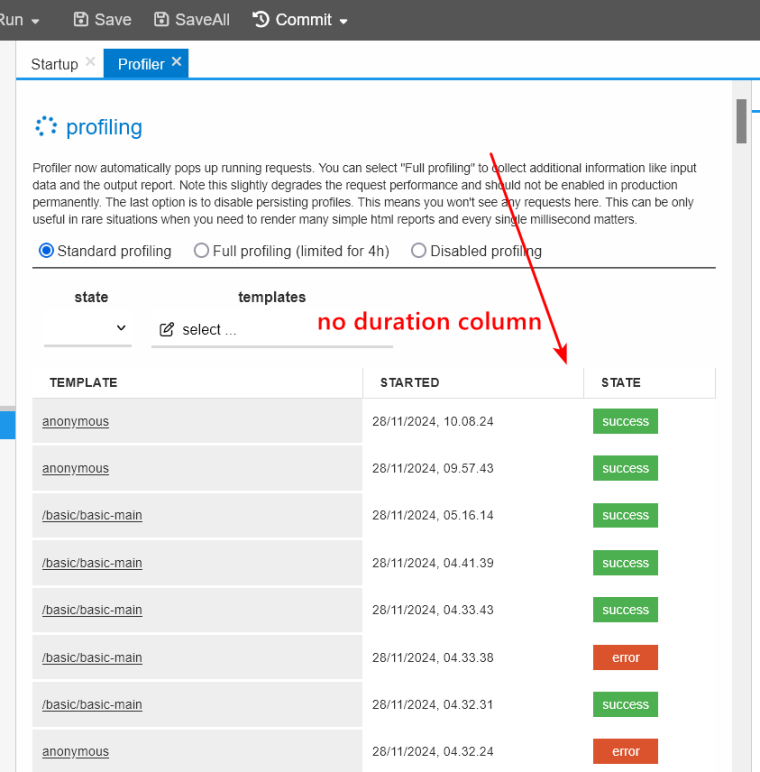
However, in the Profiler page, which I think is supposed to be a more comprehensive page on profiling requests, this column is not present. Is there a setting to add this column also to the profiler page?

Opening one of the items does indeed show the duration in the visualization of each step in the rendering process, but then you have to do the math yourself to get the total.
Of course I can always measure the time from a client app calling the jsreport API, but it will include the transport time (sending request data and also downloading the response pdf) so it's not a clean measurement since network speed is kinda unpredictable.
Screenshots are from jsreport 4.7 local installation (I wanted to try in playground but it's still on version 4.3).
I think it would be useful to also have this Duration column in the Profiler page to help measure and compare template render performances between edits.
Thank you, regards.
-
The last value is actually the duration, so you don't have to do the math...

However, we will add the duration to the profiler table as well. Thanks for the proposal.
I've submitted the task to backlog
https://github.com/jsreport/jsreport/issues/1193