Changed to shortid and everything looks correct now! Thank you so much for your help and quick responses!
Posts made by atlas365
-
RE: Report Fonts and Graph Zoom are incorrect with running reports through a scriptposted in general forum
-
RE: Report Fonts and Graph Zoom are incorrect with running reports through a scriptposted in general forum
This is what our render.js file looks like-
var fs = require('fs'); var jsreport = require('jsreport')({ tasks: { allowedModules: '*' } }); var helpers = fs.readFileSync('/home/ec2-user/reports/data/templates/composite_report_template/helpers.js', 'utf8'); var scripts = fs.readFileSync('/home/ec2-user/reports/data/scripts/composite_script/content.js', 'utf8'); var templates = fs.readFileSync('/home/ec2-user/reports/data/templates/composite_report_template/content.handlebars', 'utf8'); //defining the integer to iterate through all reports var current = 11; //only init the jsreport once jsreport.init().then(function () { timeToRun(); function timeToRun() { //add to this object for new reports - TBA South America, Greater Asia, Greater Africa var RegionEnum = Object.freeze({"chinaPremium":0, "chinaStandard":1, "caribbeanPremium":2, "caribbeanStandard":3, "menaPremium":4, "menaStandard":5, "europePremium":6, "northAmericaPremium":7, "southAmericaPremium": 8, "greaterAsiaPremium": 9, "greaterAfricaPremium": 10, "allRegions":11}); if (current === RegionEnum.chinaPremium) { runReport(0, 1, 0, 0); } if (current === RegionEnum.chinaStandard) { runReport(0, 0, 0, 0); } if (current === RegionEnum.caribbeanPremium) { runReport(1, 1, 0, 0); } if (current === RegionEnum.caribbeanStandard) { runReport(1, 0, 0, 0); } if (current === RegionEnum.menaPremium) { runReport(2, 1, 1, 0); } if (current === RegionEnum.menaStandard) { runReport(2, 0, 0, 0); } if (current === RegionEnum.europePremium) { runReport(3, 1, 1, 0); } if (current === RegionEnum.northAmericaPremium) { runReport(4, 1, 1, 0); } if (current === RegionEnum.southAmericaPremium) { runReport(5, 1, 1, 0); } if (current === RegionEnum.greaterAsiaPremium) { runReport(6, 1, 1, 0); } if (current === RegionEnum.greaterAfricaPremium) { runReport(7, 1, 1, 1); } if (current === RegionEnum.allRegions) { runReport(8, 1, 0, 1) } } function runReport(regionName, typeName, country, end){ //function start return jsreport.render({ template: { content: templates, helpers: helpers, engine: 'handlebars', scripts: [{ content: scripts }], recipe: 'phantom-pdf' }, data: { region: regionName, type: typeName, bycountry: country } }).then(function(resp) { process.nextTick(function() { current++; if (end === 1) { process.exit(); } timeToRun(); }); }); } }).catch(function (e) { console.error(e.stack); process.exit(1); }); -
RE: Report Fonts and Graph Zoom are incorrect with running reports through a scriptposted in general forum
Thanks for quick reply! jsreport and our render code are both on the ec2 instance. They're actually located in the same directory. I tried adding the suggested css styles and it just kind of scaled down the whole PDF.
-
Report Fonts and Graph Zoom are incorrect with running reports through a scriptposted in general forum
Hello,
I am experiencing differences in the generated pdf that comes out of JSReport Studio compared to running a script that runs the same template/scripts. In jsreport the pdf is generated correctly and the file is saved to the right location. We are now trying to automate the generation process so each report doesn't have to be manually generated each week.
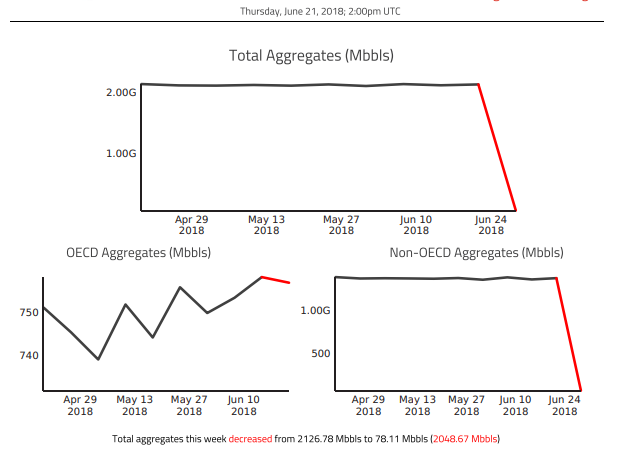
Here is a snippet of one of our generated reports from jsreport studio-

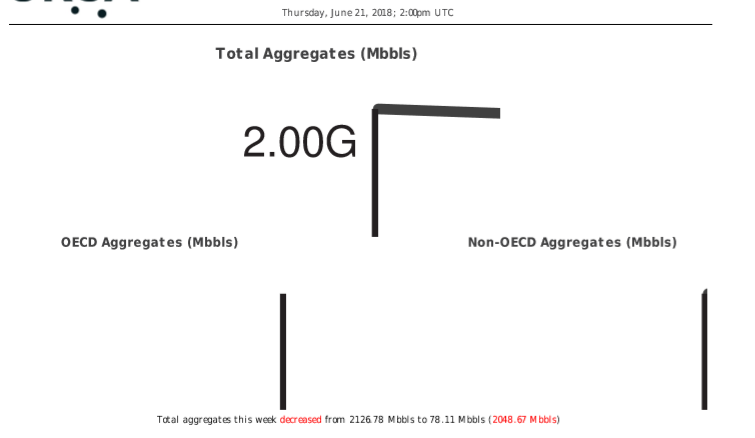
Now compare to what is generated from jsreport.render(...)

The graphs are zoomed into the top left corner and the fonts are not the same. D3 is being used to generate the graphs. It's weird because it seems the svg is the correct size but the graph inside it is not using the correct dimensions.
Everything is being ran on an ec2 instance. We are using handlebars and phantom-pdf. Have you seen anything like this before?
Thanks in advance,
Trevor