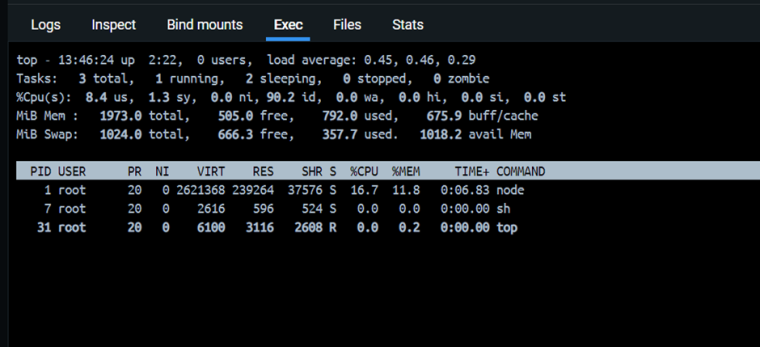
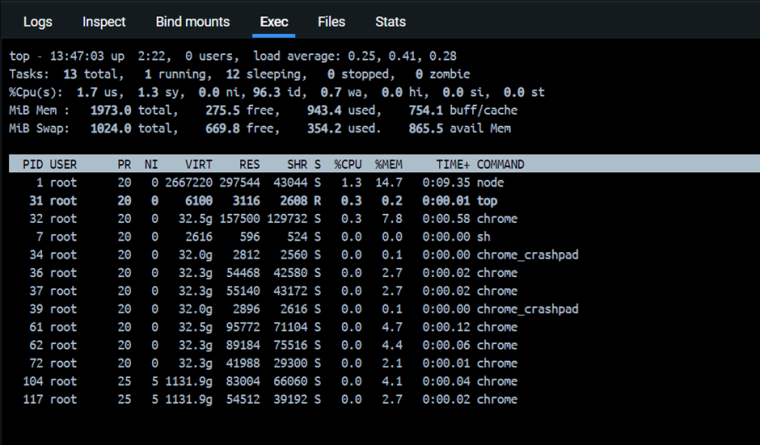
This is my case, when I start a pod with jsreport I have these statistics. Here I have 505 MB of free memory
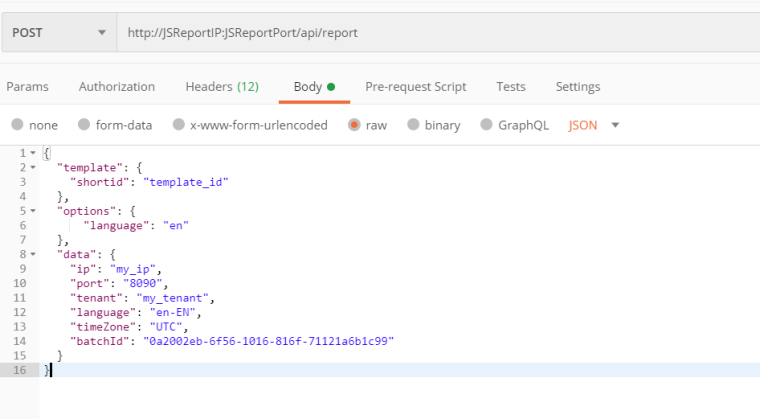
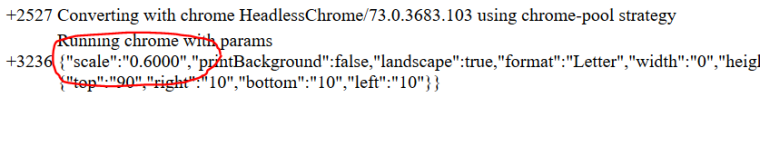
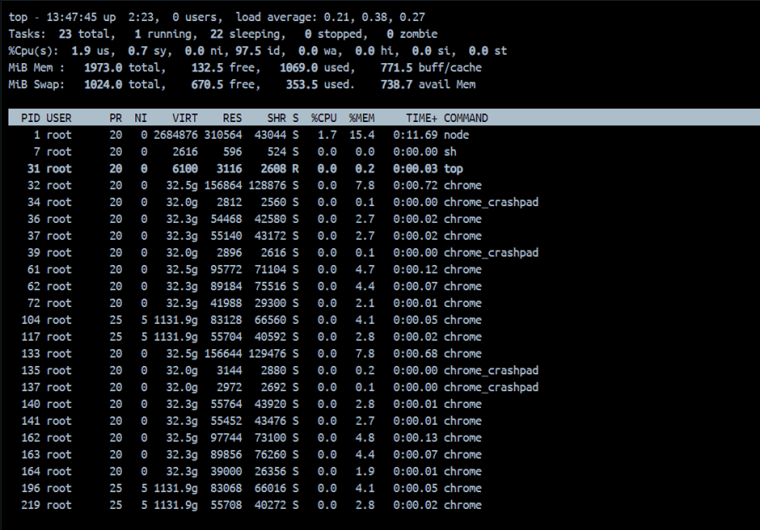
After running the first report (I use the invoice pdf https://playground.jsreport.net/w/admin/hBfqC7af). My free memory decreases as shown in a message:
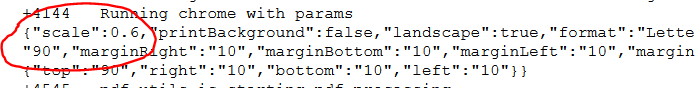
The memory after sending the same report (second time):
After 15 minutes of rendering the report, I have this result:
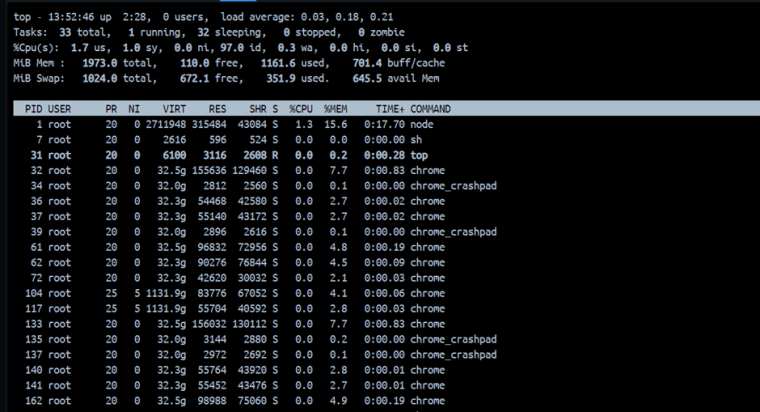
The chrome command is never cleared. All my reports use Chrome PDF.