After changing the configuration file do I need to do anything special to reload it. I am using Pm2.
I
iii-james
@iii-james
0
Reputation
15
Posts
2372
Profile views
0
Followers
0
Following
Posts made by iii-james
-
RE: File size of data/reports is getting largeposted in general forum
-
File size of data/reports is getting largeposted in general forum
After upgrading to 4.x I noticed the reports file inside the data directory was getting huge. I am not sure what the purpose of this file is but it was something like 3.62GB this morning. I had to delete it to recover HD space. Is this normal? Is there there a setting to keep the size smaller?
-
RE: Upgrading from 3.13.0 To 4.10.0 no longer generates PDF.posted in general forum
This may give you a clue about the issue. I discovered if I remove
-webkit-transform: rotate(-45deg);from the CSS there is no error but the text is not rotated. -
RE: Upgrading from 3.13.0 To 4.10.0 no longer generates PDF.posted in general forum
The error I get in v4.3.0 but not in v4.2.0 is below as well as the template.
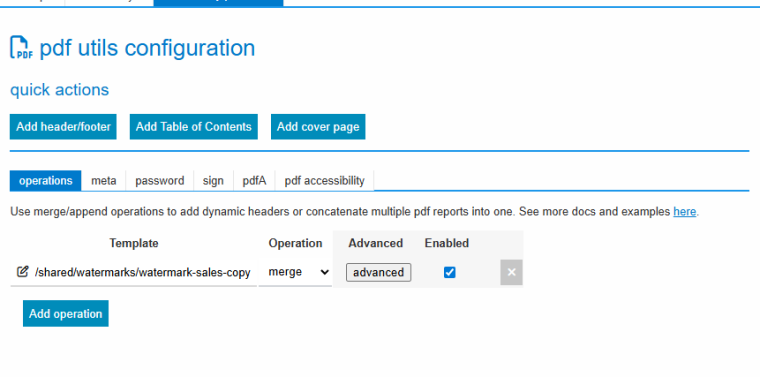
    .center {
        position: fixed;
        top: 25%;
        left: 55%;
        margin-top: -150px;
        margin-left: -150px;
    }

    .center>img {
        opacity: 0.3;
    }
    .watermark {
        font-family: Impact, sans-serif;
        -webkit-transform: rotate(-45deg);
        opacity: 0.18;
        font-size: 10em;
        font-weight: bolder;
        width: 100%;
        text-align: center;
        z-index: 1000;
        -webkit-text-fill-color: white;
        -webkit-text-stroke-width: 8px;
        -webkit-text-stroke-color: black;
    }
</style>

<div class="center">
    <div class="watermark">SALES COPY</div>
</div>
Report "order-entry" render failed. Error while executing pdf-utils operations (because) incorrect header check Error: incorrect header check at Zlib.zlibOnError [as onerror] (node:zlib:189:17) at processChunkSync (node:zlib:457:12) at zlibBufferSync (node:zlib:178:12) at Object.syncBufferWrapper [as unzipSync] (node:zlib:792:14) at mergePage (/var/lib/jsreportapp-4.3.0/node_modules/@jsreport/pdfjs/lib/mixins/merge.js:63:22) at merge (/var/lib/jsreportapp-4.3.0/node_modules/@jsreport/pdfjs/lib/mixins/merge.js:162:22) at /var/lib/jsreportapp-4.3.0/node_modules/@jsreport/pdfjs/lib/mixins/merge.js:7:64 at Document.asBuffer (/var/lib/jsreportapp-4.3.0/node_modules/@jsreport/pdfjs/lib/document.js:68:13) at async Object.merge (/var/lib/jsreportapp-4.3.0/node_modules/@jsreport/jsreport-pdf-utils/lib/pdfManipulator.js:53:23) wrapped by: Error: Error while executing pdf-utils operations (because) incorrect header check at module.exports (/var/lib/jsreportapp-4.3.0/node_modules/@jsreport/jsreport-core/lib/shared/createError.js:10:13) at WorkerReporter.createError (/var/lib/jsreportapp-4.3.0/node_modules/@jsreport/jsreport-core/lib/shared/reporter.js:53:12) at AsyncFunction.<anonymous> (/var/lib/jsreportapp-4.3.0/node_modules/@jsreport/jsreport-pdf-utils/lib/worker.js:233:22) at async ListenerCollection.fire (/var/lib/jsreportapp-4.3.0/node_modules/@jsreport/jsreport-core/lib/shared/listenerCollection.js:157:21) at async afterRender (/var/lib/jsreportapp-4.3.0/node_modules/@jsreport/jsreport-core/lib/worker/render/render.js:102:5) at async WorkerReporter._render (/var/lib/jsreportapp-4.3.0/node_modules/@jsreport/jsreport-core/lib/worker/render/render.js:149:7) at async /var/lib/jsreportapp-4.3.0/node_modules/@jsreport/jsreport-core/lib/worker/reporter.js:227:24 at async processAndResponse (/var/lib/jsreportapp-4.3.0/node_modules/@jsreport/advanced-workers/lib/workerHandler.js:41:17) -
RE: Upgrading from 3.13.0 To 4.10.0 no longer generates PDF.posted in general forum
Doing the fresh install ,as you mentioned, fixed the original issue. However I ended up having to downgrade to version 4.2.0. In version 4.3.0 and up I am having an issue with pdf-utils. I can create a new post regarding that problem.
-
RE: Upgrading from 3.13.0 To 4.10.0 no longer generates PDF.posted in general forum
The ones I tried were small reports. I ran the chrome dependencies but it looks like it was up to date. I did update node from v18.17.1 to v20.10.0 but have not had the opportunity to re run the upgrade procedure.
sudo apt update && sudo apt install -y gconf-service libgbm-dev libasound2 libatk1.0-0 libc6 libcairo2 libcups2 libdbus-1-3 libexpat1 libfontconfig1 libgcc1 libgconf-2-4 libgdk-pixbuf2.0-0 libglib2.0-0 libgtk-3-0 libnspr4 libpango-1.0-0 libpangocairo-1.0-0 libstdc++6 libx11-6 libx11-xcb1 libxcb1 libxcomposite1 libxcursor1 libxdamage1 libxext6 libxfixes3 libxi6 libxrandr2 libxrender1 libxss1 libxtst6 ca-certificates fonts-liberation libappindicator1 libnss3 lsb-release xdg-utils [sudo] password for jsreport: Hit:1 http://us.archive.ubuntu.com/ubuntu focal InRelease Get:2 http://us.archive.ubuntu.com/ubuntu focal-updates InRelease [128 kB] Get:3 http://us.archive.ubuntu.com/ubuntu focal-backports InRelease [128 kB] Get:4 http://us.archive.ubuntu.com/ubuntu focal-security InRelease [128 kB] Fetched 383 kB in 2s (214 kB/s) Reading package lists... Done Building dependency tree Reading state information... Done 65 packages can be upgraded. Run 'apt list --upgradable' to see them. Reading package lists... Done Building dependency tree Reading state information... Done fonts-liberation is already the newest version (1:1.07.4-11). libatk1.0-0 is already the newest version (2.35.1-1ubuntu2). libcairo2 is already the newest version (1.16.0-4ubuntu1). libfontconfig1 is already the newest version (2.13.1-2ubuntu3). libpango-1.0-0 is already the newest version (1.44.7-2ubuntu4). libpangocairo-1.0-0 is already the newest version (1.44.7-2ubuntu4). libxcb1 is already the newest version (1.14-2). libxcomposite1 is already the newest version (1:0.4.5-1). libxcursor1 is already the newest version (1:1.2.0-2). libxdamage1 is already the newest version (1:1.1.5-2). libxext6 is already the newest version (2:1.3.4-0ubuntu1). libxfixes3 is already the newest version (1:5.0.3-2). libxi6 is already the newest version (2:1.7.10-0ubuntu1). libxrandr2 is already the newest version (2:1.5.2-0ubuntu1). libxrender1 is already the newest version (1:0.9.10-1). libxss1 is already the newest version (1:1.2.3-1). libxtst6 is already the newest version (2:1.2.3-1). lsb-release is already the newest version (11.1.0ubuntu2). gconf-service is already the newest version (3.2.6-6ubuntu1). libappindicator1 is already the newest version (12.10.1+20.04.20200408.1-0ubuntu1). libgconf-2-4 is already the newest version (3.2.6-6ubuntu1). ca-certificates is already the newest version (20240203~20.04.1). libasound2 is already the newest version (1.2.2-2.1ubuntu2.5). libc6 is already the newest version (2.31-0ubuntu9.18). libcups2 is already the newest version (2.3.1-9ubuntu1.9). libdbus-1-3 is already the newest version (1.12.16-2ubuntu2.3). libexpat1 is already the newest version (2.2.9-1ubuntu0.8). libgbm-dev is already the newest version (21.2.6-0ubuntu0.1~20.04.2). libgdk-pixbuf2.0-0 is already the newest version (2.40.0+dfsg-3ubuntu0.5). libglib2.0-0 is already the newest version (2.64.6-1~ubuntu20.04.9). libgtk-3-0 is already the newest version (3.24.20-0ubuntu1.2). libnspr4 is already the newest version (2:4.35-0ubuntu0.20.04.1). libnss3 is already the newest version (2:3.98-0ubuntu0.20.04.2). libstdc++6 is already the newest version (10.5.0-1ubuntu1~20.04). libx11-6 is already the newest version (2:1.6.9-2ubuntu1.6). libx11-xcb1 is already the newest version (2:1.6.9-2ubuntu1.6). xdg-utils is already the newest version (1.1.3-2ubuntu1.20.04.2). libgcc1 is already the newest version (1:10.5.0-1ubuntu1~20.04). 0 upgraded, 0 newly installed, 0 to remove and 65 not upgraded. -
Upgrading from 3.13.0 To 4.10.0 no longer generates PDF.posted in general forum
We have our jsreport server running on a virtual ubuntu server. We took a snapshot before installing the update so we could revert back if necessary. We followed the instructions here. Everything went well until we tried to print one of our existing templates and got the following error. After reverting back it worked again so I am not sure if we missed something or what.
Protocol error (Page.printToPDF): Printing failed ProtocolError: Protocol error (Page.printToPDF): Printing failed at new Callback (/var/lib/jsreportapp/node_modules/puppeteer-core/lib/cjs/puppeteer/common/Connection.js:62:35) at CallbackRegistry.create (/var/lib/jsreportapp/node_modules/puppeteer-core/lib/cjs/puppeteer/common/Connection.js:108:26) at Connection._rawSend (/var/lib/jsreportapp/node_modules/puppeteer-core/lib/cjs/puppeteer/common/Connection.js:224:26) at CDPSessionImpl.send (/var/lib/jsreportapp/node_modules/puppeteer-core/lib/cjs/puppeteer/common/Connection.js:433:78) at CDPPage.createPDFStream (/var/lib/jsreportapp/node_modules/puppeteer-core/lib/cjs/puppeteer/common/Page.js:738:88) at CDPPage.pdf (/var/lib/jsreportapp/node_modules/puppeteer-core/lib/cjs/puppeteer/common/Page.js:771:37) at /var/lib/jsreportapp/node_modules/@jsreport/jsreport-chrome-pdf/lib/conversion.js:391:27 at process.processTicksAndRejections (node:internal/process/task_queues:95:5) at async /var/lib/jsreportapp/node_modules/@jsreport/jsreport-chrome-pdf/lib/conversion.js:432:22 -
RE: Using the built in NodeJs fetch client does not have the same return type.posted in general forum
@admin I think I get it now. I am able to recreate what my client was expecting with the following code. It needed a body property with the data and a headers property with a
permanent-linkproperty. Thanksconst body = await response.text(); const permanentLink = await response.headers.get('permanent-link'); return {data:{body,headers:{'permanent-link':permanentLink}}}; -
Using the built in NodeJs fetch client does not have the same return type.posted in general forum
I am upgrading my app and going to use the built in http client 'fetch'. I have been using the request library that is now deprecated. I am having an issue with what 'fetch' returns from JsReport. I am getting a string so when 'response.json()''' is called I get error
'Unexpected token '%', "%PDF-1.6\n%"... is not valid JSON'. When I call the same url with 'request' I get an object. It seems like 'fetch' only returns the content of the body property. Is anyone having a similar issue?request code:
    const promise = new Promise<any>((resolve, reject) => {
      const options = {
        json: data,
        uri: 'http://jsreport.innovationind.com/api/report'
      };
      post(options, (err, result) => {
        if (err) {
          return reject(err);
        }
        resolve(result);
      });
    });
    return promise;
fetch code:
try { const response = await fetch('http://jsreport.innovationind.com/api/report', { method: 'POST', headers: { 'Accept': 'application/json', 'Content-Type': 'application/json' }, body:JSON.stringify(data) }); if (response.ok && response.body) { const body = await response.json(); //error occurs here return body; } else { throw new Error('Failed to fetch the report'); } } catch (error: any) { logger.error(error); return Promise.resolve(error); } -
RE: Add a watermark to second of 3 PDF'sposted in general forum
@admin thanks for pointing that out. I had to prefix the data with @root because I was inside an iteration.