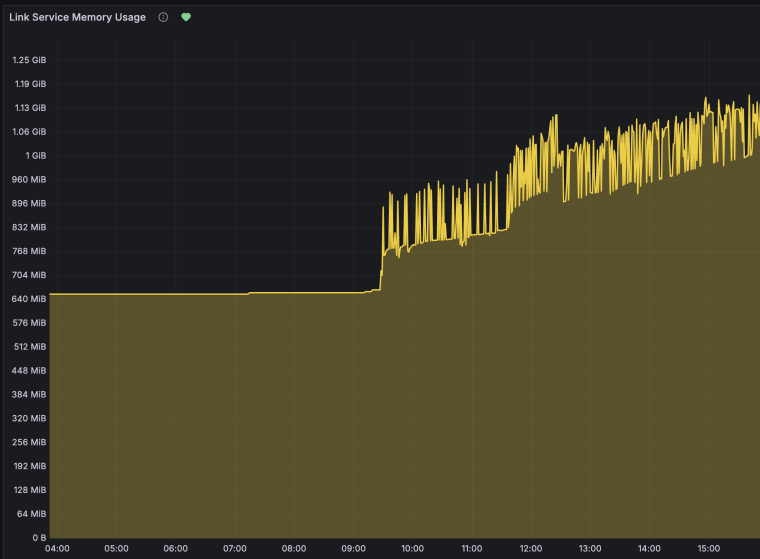
We are observing a slow but constant memory growth tested on jsreport 4.12.0 running in Docker when generating PDF reports via the chrome-pdf recipe. Memory increases linearly with the number of rendered reports and is never reclaimed, even after extended idle periods.
Environment:
jsreport 4.12.0 (official Docker image jsreport/jsreport:4.12.0)
Docker version 29.1.4-rd
Default configuration (no custom extensions, authentication disabled)
2 Chrome workers (default)
Reproduction steps:
Start the official jsreport container:
docker run -d --name jsreport-memtest -p 15488:5488 \
  -e "extensions_authentication_enabled=false" \
  jsreport/jsreport:4.12.0
Check initial memory baseline:
docker stats jsreport-memtest --no-stream --format "{{.MemUsage}}"
# ~226 MiB
Send 500 PDF render requests (100 rounds × 5 parallel) using the script below:
# Save as memory-stress-test.sh
for i in $(seq 1 500); do
  curl -s -o /dev/null -X POST http://localhost:15488/api/report \
    -H "Content-Type: application/json" \
    -d '{
      "template": {
        "content": "<html><body><h1>Memory Test #'$i'</h1><table>'$(printf '<tr><td>Row %s</td><td>Value</td><td>Lorem ipsum dolor sit amet</td></tr>' $(seq 1 50))'</table></body></html>",
        "engine": "handlebars",
        "recipe": "chrome-pdf",
        "chrome": { "landscape": true, "format": "A4" }
      }
    }' &
  # Run 5 in parallel, then wait
  if (( i % 5 == 0 )); then
    wait
    sleep 0.5
  fi
done
wait
Check memory after 500 reports:
docker stats jsreport-memtest --no-stream --format "{{.MemUsage}}"
# ~1062 MiB
Wait 30 seconds (idle — no requests) and check again:
docker stats jsreport-memtest --no-stream --format "{{.MemUsage}}"
# ~1055 MiB — memory is NOT reclaimed
Send another 1000 PDF render requests (same script, seq 1 1000) and check:
docker stats jsreport-memtest --no-stream --format "{{.MemUsage}}"
# ~1110 MiB — another +56 MiB that is never reclaimed
Observed results:
| Phase | Reports rendered | Mem start | Mem end | Delta |
|---|---|---|---|---|
| Batch 1 | 500 | 226 MiB | 1062 MiB | +836 MiB |
| 30s idle | 0 | 1062 MiB | 1055 MiB | -7 MiB |
| Batch 2 | 1000 | 1054 MiB | 1110 MiB | +56 MiB |
| 30s idle | 0 | 1110 MiB | 1106 MiB | -4 MiB |
| Batch 3 | 2000 | 1102 MiB | 1225 MiB | +123 MiB |
The initial jump (~800 MiB) is mostly Chrome worker startup, which is expected. However, after stabilization, memory continues to grow at approximately +56 MiB per 1000 reports and is never garbage collected.
No zombie processes were found inside the container — this is not a process reaping issue.
Expected behavior:
After rendering is complete, memory should return close to the post-warmup baseline (~1000 MiB), not continue growing indefinitely.
Impact in production on our customer:
In long-running containers that process reports continuously (e.g. scheduled exports every few minutes), this leak accumulates over hours/days and eventually causes OOM kills restarting the Kubernetes pod
4 worker with dedicated-process strategy