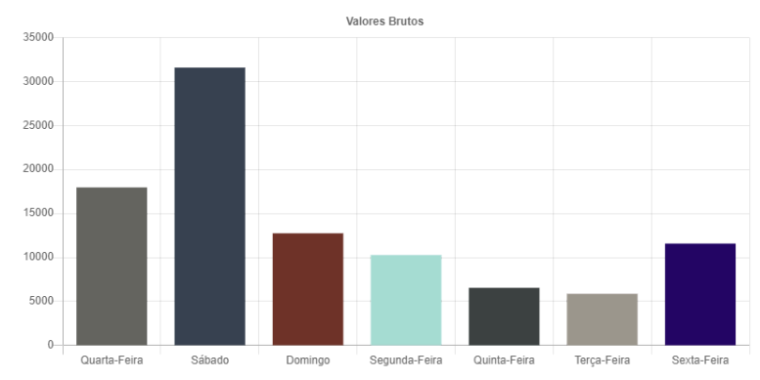
<!-- GRAPHICS-->
{{if graphTotal}}
<canvas id="graph" class={{toJSON graphTotal.graphClass}}{{/toJSON}} style="margin:auto;margin-top:45px;"></canvas>
<script>
    var chart = "graph";
    var ctx = document.getElementById(chart).getContext('2d');
    var myChart = new Chart(ctx, {
      type: {{toJSON graphTotal.graphType}}{{/toJSON}},
      data: {{toJSON graphTotal}}{{/toJSON}},
      options: {
           elements: {
                line: {
                    tension: 0,
                    fill: false,
                }
            },
            legend: {
                display: false,
                position: "bottom",
            },
            title: {
                display: true,
                text: {{toJSON graphTotal.graphTitle}}{{/toJSON}}
            },
            plugins: {
                datalabels: {
                    display: {{if graphTotal.graphDatalabels == true}}"auto"{{else}}{{toJSON graphTotal.graphDatalabels}}{{/toJSON}}{{/if}},
                    color: "#fff",
                    formatter: function(value, context) {
                        return  value + ' ' + {{toJSON graphTotal.graphSymbol}}{{/toJSON}};
                    }
                },
            },
        scales:{
                xAxes: [{
                    display: {{toJSON graphTotal.displayX}}{{/toJSON}},
                    stacked: {{toJSON graphTotal.graphX}}{{/toJSON}},
                    scaleLabel: {
                        display: {{toJSON graphTotal.scaleLabelDisplayX}}{{/toJSON}},
                        labelString: {{toJSON graphTotal.scaleLablelStringyX}}{{/toJSON}},
                    }
                }],
                yAxes: [{
                    display: {{toJSON graphTotal.displayY}}{{/toJSON}},
                    stacked: {{toJSON graphTotal.graphY}}{{/toJSON}},
                    ticks: {
                            beginAtZero: {{toJSON graphTotal.beginAtZeroY}}{{/toJSON}}
                        },
                    scaleLabel: {
                        display: {{toJSON graphTotal.scaleLabelDisplayY}}{{/toJSON}},
                        labelString: {{toJSON graphTotal.scaleLablelStringyY}}{{/toJSON}},
                    }
                }]
            },
        }
    });
</script>
{{/if}}
