Xlsx chart from the html table
-
Hi I tryed to make a chart from html to xlsx. The data to the chart are imported from the API to the HTML and then generate the xlsx report. The table I generated on xlsx byt I cant figurate how to make a chart from this table;/ what kind of snipet I should use?
Best Regards
-
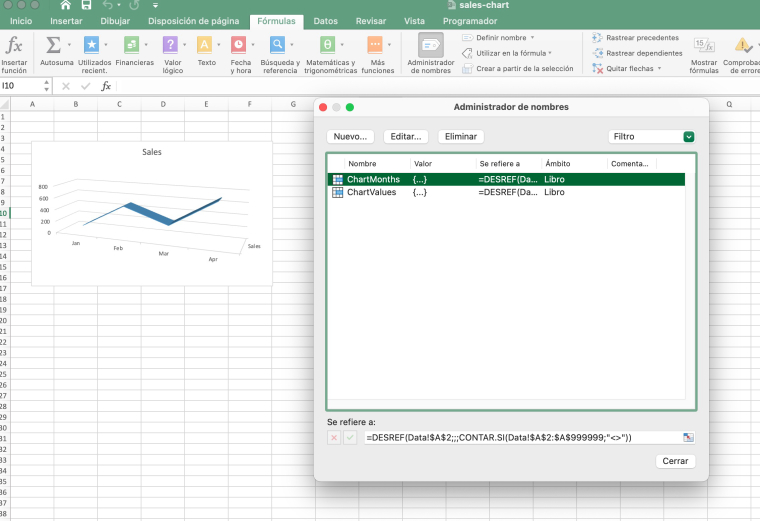
hi! an example of what you are trying to do is available here https://playground.jsreport.net/w/admin/QiHIBqsq
i guess what you are missing is configuring your chart source to be dynamic, this can be done using excel formulas, check this for a description of the steps to get there https://jsreport.net/learn/dynamic-excel-pivot-table#excel-template
knowing that you will find that the template on the playground example is using this formulas to work and the html-to-xlsx just create the table based on data, so everything combines
-
Ok, thanks it's working :) but now how to insert chart and the table on one sheet?
What is the snipet for puting chart on the sheet?Best regards
-
@AqMarek there is no snippet when it comes to this example, generating a chart from scratch (i mean with no previous chart created in the document itself) is a bit complex. the main and general approach we take to deal with these kinds of rich objects in docx, xlsx is that we expect these objects to exist in the document, as part of the template and in runtime we just configure it or tweak it to achieve the desired result in the final document.
this approach works really well and it seems it works for all the users so far (i mean i just remember just a few moments users wanted to generate something from scratch without it existing in the document itself). is it something stopping you to use this approach? i mean creating a xlsx document that works as a template and that in runtime we just process it to get the desired output, this can be done by using the xlsx recipe (not the html-to-xlsx recipe), like this example
-
ok, I tryed to use xlsx recipe but there is still problem. My date are generated dynamic from API when I tryed to make dynamic chart there is something like that:
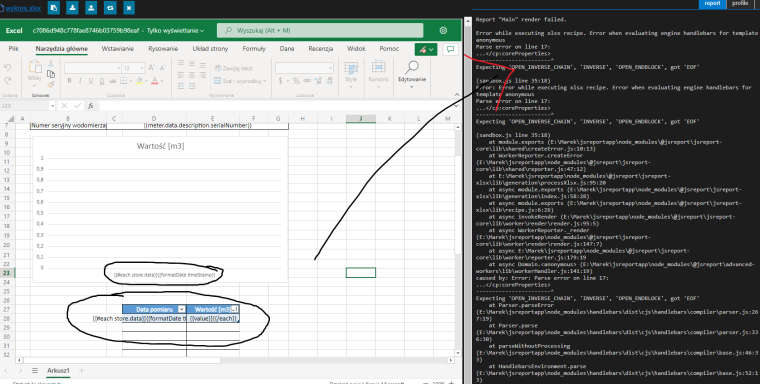
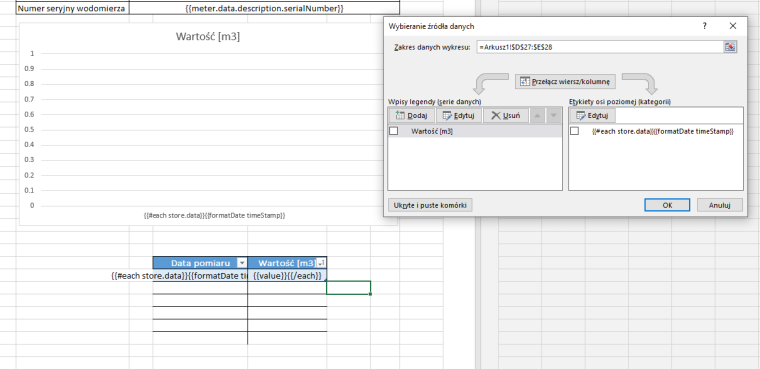
when I changed the scope of data (wihtout handelbars) they showing the data but there i now chart :(
-
It's look like chart in xlsx doesn't suport the handelbars snipet
-
or I wrong use {{#each store.data}}{{formatDate timeStamp}}{{round value}}{{/each} in the table
-
the chart can be produced in two ways (both require that a chart object exists in the xlsx template):
1.- you configure the chart directly with the
xlsxCharthelper, adding a{{xlsxChart data=chartData}}to the chart title, in this method the data of the chart lives inline in the chart itself, so it won't be visible in the document.
2.- you configure the chart to use excel formulas that point to a table, and you make the table dynamicI guess what you want is method 2, right? because you want both the chart and the table to be in the same sheet. the best is that you share what you have so far in https://playground.jsreport.net/ , add your template and xlsx template there and also attach some data we can use to generate the report (if your data comes from API, generate a request and save that json in a data entity in the playground), this will help in checking what the wrong part is.
-
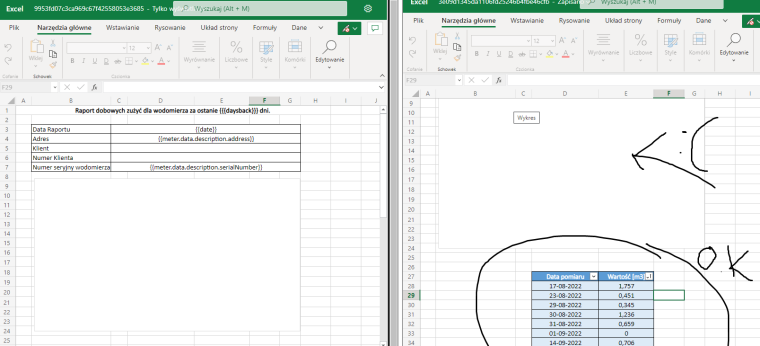
ok you can check my project
https://playground.jsreport.net/w/AqMarek/PGH98xD3
-
ok i see, i have confirmed that this case is producing a bug, the handlebars
{{#eachis getting processing also on the chart and it breaks the process because of that, i have opened an issue to solve this, subscribe here to know when it gets fixed. thanks!