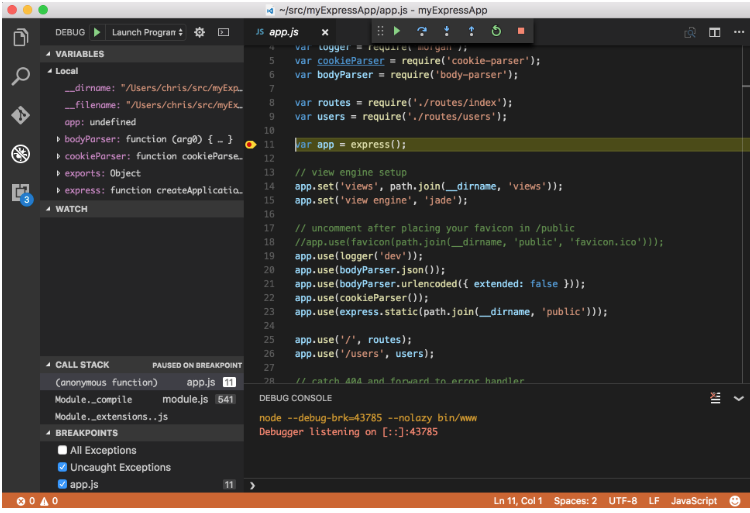
How Can I Debug Jsereport in Visual Studio Code?? Thanks!!
-
I'm trying debugging Jsreport using Visual Studio Code. Please I need help. Thanks.
Note: I'm trying something like this...

-
Debugging jsreport seems to work fine for me. Just open in vscode the folder with application.
Have something similiar in
.vscode/launch.json{ // Use IntelliSense to learn about possible Node.js debug attributes. // Hover to view descriptions of existing attributes. // For more information, visit: https://go.microsoft.com/fwlink/?linkid=830387 "version": "0.2.0", "configurations": [{ "type": "node", "request": "launch", "env": { "NODE_ENV": "development" }, "name": "Launch Program", "program": "${workspaceRoot}/server.js", "cwd": "${workspaceRoot}" }] }And hit f5, you can put breakpoint somehere to jsreport source and it should work.
Unfortunately you wan't be able to debug your helpers this way. There are many issues with it.
If this is what you want to reach, you need to stick with addingconsole.logto your helpers and run the templates withDebugbutton in studio to see the output.
-
Hi Sr. Thanks.
My breakpoints only work in "server.js" file, on other scripts don't work. I don't know why. Do you have any idea??
-
Hm. It works for me, I can put breakpoint for example here and it gets hit when I render a template
https://github.com/jsreport/jsreport-templates/blob/master/lib/templates.js#L28Not likely relevant, but I have this in my user settings
// Place your settings in this file to overwrite the default settings
{
    "search.exclude": {
        "**/node_modules": false
    },
    "eslint.autoFixOnSave": true,
    "files.autoSave": "onFocusChange",
    "terminal.integrated.shell.windows": "\\windows\\sysnative\\cmd.exe",
    "workbench.colorTheme": "One Monokai"
}
-
It don't work for me :( I don't know why, I just want debugging in the "beforeRender" method, is it posible?
-
Hi @rober, as @pofider had said before, you won't be able to debug your helpers or scripts in that way, jsreport by default handle scripts and helpers execution in another process (child processes) for security reasons so i think that is the reason the VS Code can't detect breaking points in your scripts.
however i think that you can configure jsreport for instead of running the scripts in another process make them run in the same process, using this, VS Code should be able to detect your breakpoints because script will be running in the same process, to configure that behaviour add this to your jsreport config:
"tasks": {
   ...other options that might you have here..
    "strategy": "in-process",
    ...other options that might you have here..
  },
that change should be sufficient for when you need to debug something in helpers or tasks
-
@bjrmatos This is good hint, but unfortunately it won't be enough. We pass such scripts to node.js vm in string and it has no way to find out it actually comes from a file.
https://nodejs.org/api/vm.html#vm_vm_runinnewcontext_code_sandbox_options
@rober I believe that the solution for you is
- Change the strategy as @bjrmatos mentioned
- Take the code you want to debug and put it into extra file
myScript.jsin your application directory - Allow requiring this file with additional config
"scripts": { "allowedModules":"*" } - put this to your script
var path = require('path')
var myScript = require(path.join(__appDirectory, 'myScript.js'))
function beforeRender(req, res, done) {
  myScript(req, res, done)
}
-
perfect!!!!! It work for me!!!!!! :) Very good attention thanks!!!!

