jsreport maxes out my cpu cores even when idle
-
What does jsreport do when idle?
I'm running all of my servers in local docker while developing. I have 5 nodejs containers, one nginx, one jsreport and one postgres container.I'm not rendering reports and I don't have Studio open. I just figured out why my macbook fans are running on max all the time. I thought I stressed the macbook by running that many docker images, but it turns out that jsreport is the sole villain here.
If I stop the jsreport container the cpu % for Docker goes from 300% to 5%. The fans are completely silent if I don't run jsreport.
Here are the iStats history on my 6 cores. Look what happened when I stopped jsreport!
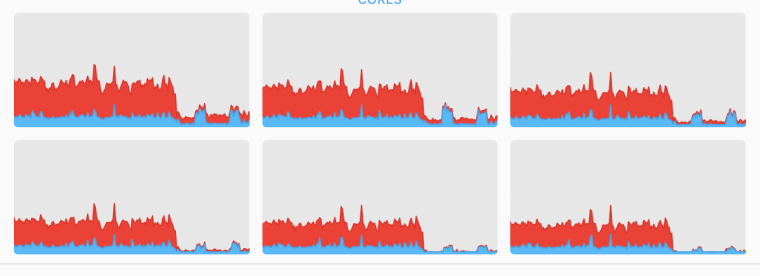
-
jsreport does temp files cleaning, templates change monitoring, checking for schedules on background.
Please try to isolate the problem...
Do you have the same experience with the newest jsreport?
Do you see the same without docker?
Do you see the same with just hello world templates?
What is in the debug logs?
...
-
I'm using the official 2.6.1 docker image. I've probably had the same problem since 2.5. Today I discovered that jsreport took all cpu.
Here is my Dockerfile:
COPY license-key.txt /app
COPY ./mounted/jsreport.config.json /app
# COPY ./mounted/data /app/data

ENV templatingEngines:strategy in-process
ENV node --max-old-space-size=3072

RUN cd /app && npm install \
  moment \
  moment-timezone \
  intl \
  handlebars-helpers \
  node-fetch \
  jsreport-assets \
  jsreport-static-pdf
The config file:
{
  "httpPort": 5488,
  "allowLocalFilesAccess": true,
  "store": {
    "provider": "fs"
  },
  "blobStorage": {
    "provider": "fs"
  },
  "templatingEngines": {
    "numberOfWorkers": 2,
    "timeout": 600000,
    "strategy": "in-process"
  },
  "chrome": {
    "timeout": 600000
  },
  "extensions": {
    "scripts": {"timeout": 600000},
    "chrome-pdf": {
      "strategy": "chrome-pool",
      "numberOfWorkers": 2
    },
    "express": {
      "inputRequestLimit": "50mb",
      "renderTimeout": 600000
    },
    "child-templates": {
      "parallelLimit": 2
    }
  }
}
Here is the log from starting jsreport until I stopped it. When I started the jsreport container Docker's cpu utilization immediately went from sub 10% to over 300%. The fans also started immediately. There are no logs created while running. The loogs in the below image is from jsreport startup, after this nothing happens in the logs.
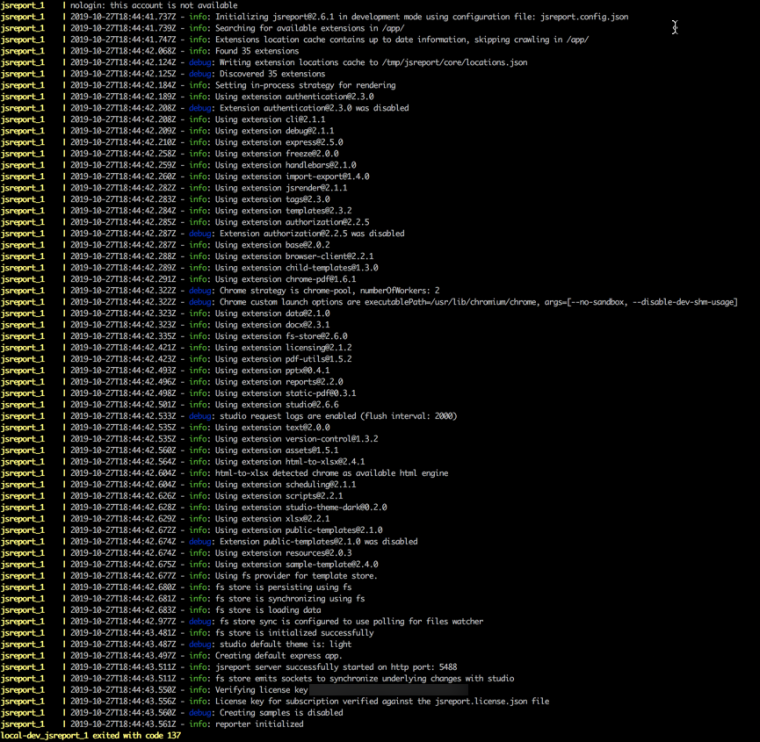
-
Unfortunately, this isn't helping. Please try to isolate the problem with the steps I proposed.
Additionally, you can also try to run the default jsreport image and see if the behavior is different.
Also If you connect to the CPU consuming container and check the running processes. Is it the node process consuming all the CPU?
-
I have done some more testing.
- Started an empty jsreport container -> 5% CPU
- Started my container with a bunch of templates -> 300% CPU
The templates are stored in a local mounted volume. I started to remove templates from the mounted volume and discovered that the CPU load went down.
After removing all templates the CPU load was quite acceptable (10-20%). I started to add empty files and discovered that the CPU load is almost proportionate to the number of files.
I think something is going on with the template change monitoring.
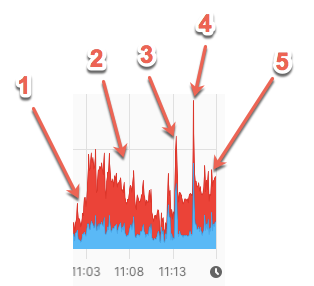
Below is a CPU chart from my experiment:
- Started jsreport with a bunch of templates
- Removed the templates one by one
- Added 50 empty files to the data/templates folder
- Added 50 more empty files
- No templates exists, but 100 empty files are in the mounted data/templates
-
I should add:
- Before the experiment I upgraded to latest Docker desktop for mac (2.1.0.4)
- macOS 10.14.6, all system updates applied
- Macbook Pro 2018, 32GB RAM, SSD, 2.6GHz core i7
-
Please try this config. It should disable the change monitoring
"extensions": {
  "fs-store": {
     "syncModifications": false
  }
}
If it helps, please enable it back and apply this config
"extensions": {
  "fs-store": {
     "sync": {
       "usePolling": false
     }
  }
}
Here are some notes to this config
https://github.com/paulmillr/chokidar#performance
-
Thanks!
"usePolling: false" did the trick.Do I need to have a different config for the production image?
Will I loose any essential functionality with usePolling: false on an Amazon Linux container? I'm specifically thinking of template updating via Studio.
-
I would recommend to try it out with the same config and see.
I believe there should be no difference in functionality.Thank you for your inputs and the problem isolation.
-
I've been postponing the hunt for a solution to this problem. Until now my solution has been to occationaly shut down jsreport to save the fans on the MBP. Now I have all my Docker images running and Docker is barely noticeable at about 6% CPU. I almost forgot how it was to work with a quiet computer =)
Happy CPU:
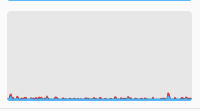
-
Hi. Just hijacking this thread.
We do have the same issue but we are using the .NET Nuget. After checking the API we found no way to configure the extension.fs-store from there.Any advice?
Thanks, Thomas
-
@tschwarzcadt Please create
jsreportfolder in your project. Inside create filejsreport.config.json, mark it to be copied to the output dir in its properties. Inside use standard jsreport configuration and use values descibed here previously.
-
Hi Jan. Thanks for the update. Will try that.
