Not able to export Charts in excel file
-
Hi All,
I want to export charts in excel file. I am not getting any solution for this.
I am able to export charts in PDF but in excel I am not getting any solution.
I tried all the link that are in playground so can anyone please help me.
I am using chart.js to prepare the charts.
thanks in advance #jsreport #excel #charts
-
I did not notice that you send the same message via email, I've replied your email but I'm going to paste the same answer here, if you have more comments, please continue the conversation here.
Hi! i guess you are using the html-to-xlsx recipe, right? the recipe is not currently able to do an automatic conversion of those charts into xlsx charts. i'm afraid that the only way to achieve charts in excel right now is to use the xlsx recipe. there is a basic example here of that here, in the real case you likely will need to inspect the xlsx file to understand what nodes you need to modify with some code in the xlsx recipe.
-
Hi Boris, Good Morning!
Thank you so much for replying.
But I have a couple of doubts can you please answer this because I wan to know whether it is possible or not?
By Using "html-to-xlsx" recipe
Question 1- Is it possible to print the dynamic charts on .xlsx file using JS library (chart.js) Similar to PDF we are generating?
Question 2- Is there is any other way to print charts dynamically Similar to PDF, If yes then please let me know
By using another recipe, Is it possible to print dynamic charts similar to PDF(I don't want to insert another sheet for table data and all )?
Can you please let me know clearly If it is doable or not?
Also, just to inform you, I have purchased the license of JS REPORT.
Thanks in advance!
#jsreport #excel #charts
-
Hi!
to have context i'm going to put here my last reply
It will probably help if I try to explain how the charts work in the excel.
Charts in excel .xlsx (or other types of office files like .docx, pptx) are done using the existing resources of the .xlsx, or in other words it is done using special tags provided by the OpenXML specification. which programs like MS Excel understand and display visually (like charts). after all a .xlsx file is just a bunch of xml files zippe, so with this in mind I'm going to clarify some of the points in your comments:
and it seems like you are not using any JS library to generate and I think the chart is already added in that template
this is correct, there is no JS library involved in the xlsx recipe example, why? because all that we need to do to generate charts in .xslx is to use the existing xml tags that represent a chart in .xlsx, however in the example you can see that we are just modifying some cells to produce a different result in the chart, why? because the .xlsx is shaped that way, that it produces a chart taking as input the data of some cells, which we are changing to produce different result in the chart. so basically the example is not creating a chart from scratch, it just modify cells to adapt the chart based on data.
If I am generating charts dynamically using script then how come I will show charts like (Pie charts or bar charts, etc) on excel file?
the short answer is that it is not possible to do it from html-to-xlsx. because it will require that we implement some kind of conversion that takes your chart generated from js and convert it to .xlsx xml tags, which is really hard, and will require that we just pick one of the many of js charts library and provide support for it, and that is an approach we are not happy with. to be clear what you can do right now in html-to-xlsx, is to have the charts defined already in the .xlsx file, those charts should be defined to be based on a xlsx sheet, and what you do with the html-to-xlsx is to insert a table with your data which alters the chart. so in this way you are able to produce a dynamic chart, but based on the definition of >existing chart in the .xlsx chart, there is no automatic js chart to xlsx chart involved.
example of inserting result of html-to-xlsx into a xlsx template with chart defined: https://playground.jsreport.net/w/admin/QiHIBqsq
Can you please let me know if you have any example in which you are generating charts using JS and then displaying charts on Excel file
right now there is no such example for the reason i explained above, and it is likely we never include support for such automatic conversion.
the plan we have in the future is to improve the xlsx recipe to have a better flow, in which you can use a template engine in the .xlsx directly to modify things, but that is all. the html-to-xlsx will also be improved with more cases, but i don't think we ever get to the js charts conversion.
my answer probably is not very positive in your case because it does not provide the solution you are looking but there is a way you can achieve the charts in the xlsx, just that it does not involve converting the charts you have in js to xlsx charts automatically.now i'm going to answer your questions:
By Using "html-to-xlsx" recipe
Question 1- Is it possible to print the dynamic charts on .xlsx file using JS library (chart.js) Similar to PDF we are generating?the only way you can get similar chart that you produce on your PDF is by making the chart in the .xlsx look the same, which means that you will need to tweak the styles of the chart using the MS Excel editor. so basically if you give it the same colors, position of labels, etc i will look almost the same as the chart produced by js on the PDF. there is no way to make it look the same with code but doing what i'm suggesting you will make it look the same by coincidence.
Question 2- Is there is any other way to print charts dynamically Similar to PDF, If yes then please let me know
no, the only way to produce charts for .xlsx files is by using the approaches i mentioned on my last reply. however i get the concern about inserting another sheet in the .xlsx, unfortunately right now that is the only way to make the chart dynamic on the html-to-xlsx, in the future we can probably let you specify some option that will produce a hidden sheet so the final .xlsx looks better.
-
Thank you so much for replying and explaining me.
So you are saying that using "xlsx" recipe only we can prepare charts right?
Last few things, I just wanted to know. As you mentioned that, I can prepare the chart in .xlsx file.
So, Is there is any example or documentation from where I can prepare Pie charts into excel (I searched a lot but not able to get a single example to prepare Pie chart in .xlsx)
I have tried 2 solutions but still not able to understand how you guys are generating chart in excel file?
1) Using the link (https://playground.jsreport.net/w/anon/rJftqRaQ-10), can you please let me know, how you have inserted line chart into excel and bind the values as well because when I am inserting it does not bind any values so it will be great if you can explain me how can I insert the Pie chart and bind value as well as per the above link example
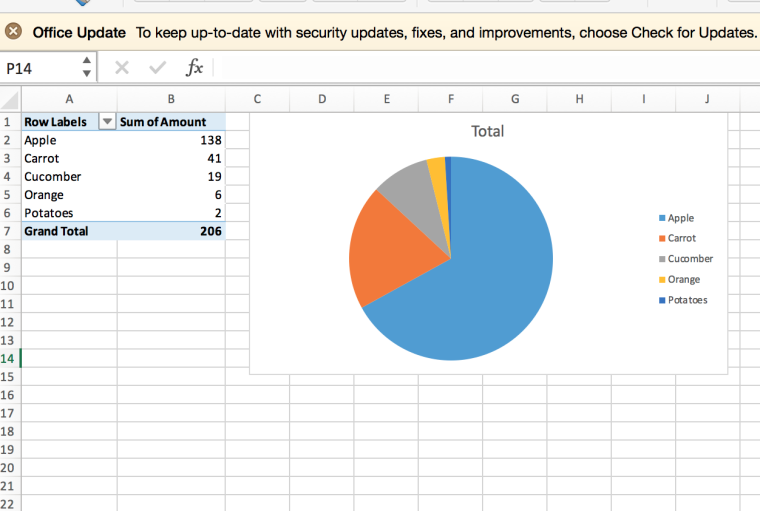
2) Using Pivot table (https://jsreport.net/learn/dynamic-excel-pivot-table), I am able to generate bar charts as I got one example, but when I am changing that chart to Pie chart or any other chart it is not working and values are not also populating.
Can you please help me on that and It will be great If we can connect for 5-10 minutes on Skype or in hangout to clear the things as we have to make the application live asap.
-
Hi!
So you are saying that using "xlsx" recipe only we can prepare charts right?
both the
html-to-xlsxand thexlsxrecipe can prepare charts, both approaches even are similar, in both, you put the chart already in the .xlsx using the MS Excel, and in another sheet you put the data, in the MS Excel you do some steps to define the chart to be updated based on the data of the other sheet, in both cases you can use the steps described in the pivot table tutorial to bind the chart with the other sheet.the only difference between the
html-to-xlsxvsxlsxrecipe, in this case, is that using thexlsxrecipe you are able to "Hide" the "Data" sheet, if that is something you don't want to show.I think the steps to produce the same example with a pie chart are straightforward, if we take one of the examples and try to modify, for example, I have downloaded the pivot-template .xlsx there and did the following:
- right-click the existing chart, selected "change chart type", selected pie > 2-D pie, then the chart is updated, i can even see the chart updated with the old sample data, (even if the "Data" worksheet is empty). you can hide the sheet with the data if you don't want to show that sheet in the output (just right-click "Data" sheet and select "Hide")
- finally i save the xlsx file and uploaded again in the playground, replacing the previous pivot-template, i've also updated the data on the playground with some different names, run the example and it works. the live example is here
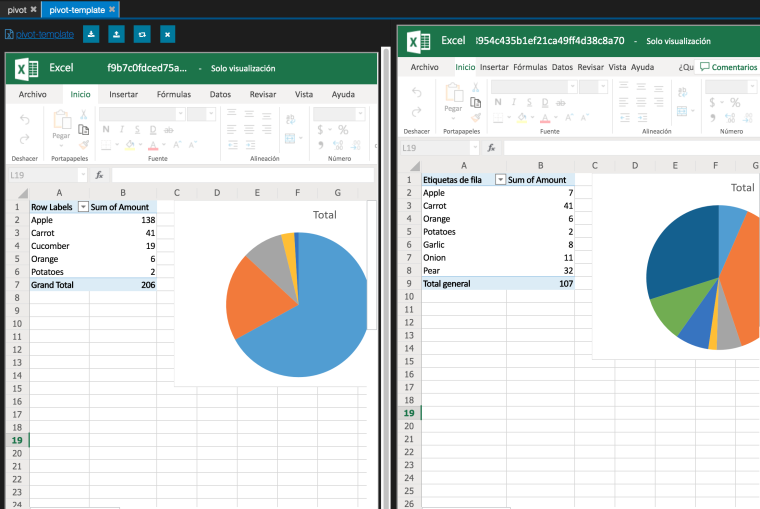
so i think you can do it the same, and any modification you need to do to the chart can be done just fine.
It will be great If we can connect for 5-10 minutes on Skype or in hangout to clear the things as we have to make the application live asap
we prefer to keep the conversation of these kinds of general common questions on the forum. so just continue here if you get more problems.