Memory leak?
-
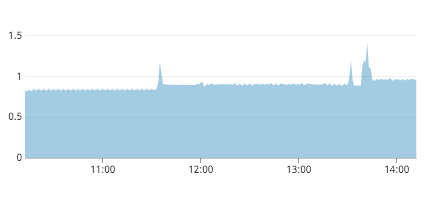
I have a quite large report (ends up in a 50MB 300 page PDF). Everytime I render the report it seems that jsreport takes up more and more memory.
The below chart is from my Datadog monitor for the AWS Fargate container where I'm running the jsreport official Docker image. The report is rendered three times and the memory footprint raises from 850 to 920 to 970 MB (approx).
I don't know how I should go on investigating this. Any suggestions?
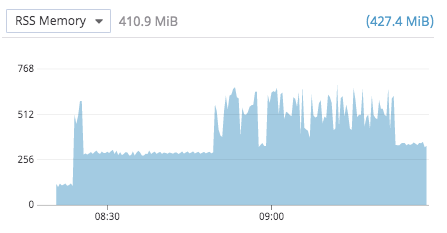
Also, 1GB seems not good. So I restarted the container. It turns out that a freshly started jsreport takes about 100MB. The server has probably leaked for some time. It has 3GB of memory, so there will be a long time between out-of-memory-restarts. I recall an automatic restart a couple of weeks ago, it was probably due to this leak.
-
I guess you aren't able to replicate this locally and send us an export so we can check the particular case?
-
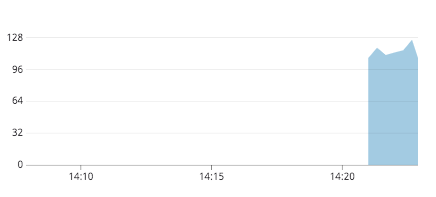
I have now ran some tests with 2.7.1. Memory consumption is very low after startup. Right after the first render of my heavy report, memory goes from 100 to 300 MB.
After rendering 15 reports memory consumption increases a bit more and it doesn't seem to release the memory.
For now, this issue is not critical. My JSreport is running in a container with 4GB of memory. When the limit is reached AWS ECS will restart the container. All my reports are rendered via a database based queue system, so my users won't notice the delay due to the restart.
It would be great to have some more insights and a solution, though. The problem is reproducible in a local Docker image, so I could email you an export from my jsreport.
-
The problem is reproducible in a local Docker image, so I could email you an export from my jsreport.
Sure, we will happily analyze it if you provide us enough information like dockerfile, templates export, what data do you send.
Feel free to email it to me.
-
I've emailed you. //Michael
-
Hey I'm seeing the same issue wondering if you ever found a solution to this and what it was.
-
No, I haven't had time to dig into this. For the time being I'm living with the problem. I gave the server 4GB of memory to prevent restarting all the time due to out-of- memory.
I just checked and saw that my jsreport container has been up for 14 days and has eaten 640MB so far.
-
Did Jan give you any insight to what the issue could be?
-
Yes, we had some communication with some insights.
@jan_blaha would it be ok for you if I posted our email communication in this thread?
-
I can't find any personal or sensitive information in Jans email, so I'll go ahead and post it here.
------------------------ From Jan ---------------------
There are three aspects to consider:- nodejs loads and compiles sources during the run time in "lazy load" fashion. This means that after the first run you get a significant rise of memory that never goes away.
- nodejs is garbage collected runtime, just like java or .net. The garbage collection which deallocates the unused memory doesn't run constantly. It starts at some point when it decides it is needed.
- we have some caches that store in memory some data, the caches get filled during the first requests typically.
I believe the most significant is the point 2 - garbage collection.
I tried to run the requests with the limited memory
docker run -p 5488:5488 --memory=400mb yourimage
Then rendering requests for more than an hour still stays inside the 400mb and there is no memory increase.
There is no out of memory error because nodejs see there is not enough more memory and triggers gc when needed.I also tried running without docker and force garbage collection after every request.
With this, I see like 260mb constant usage after every request.You mentioned you have 4gb container and you restart it automatically when it reaches some memory limit? What is that limit?
Do you see some memory settings for the container? Try to set it to a lower reasonable value. The container shouldn't go above then and trigger the gc correctly.
Note this requires using image 2.7.1, because the image 2.6.1 uses older node that doesn't work well with the memory/cgroup/docker settings.
-
Thanks for the info. Will let you know If I find the issue.
-
@msageryd So we were using the docker image for 2.5 and I tested that and 2.8. 2.5 seems to have issues with handling Memory and 2.8 does not. We are planning on updating to 2.8 to resolve this. Not sure what version your using but updating to the newest docker image might be the best option.
Thanks again for the help.
