Same old memory-crash problem =(
-
I have had memory reclaim problems at my jsreport server for several years. The last time I digged into this problem, I "closed the case", after discussion with Jan. We thought that the memory in the graph would be automatically garbage collected when needed. But I don'think this works very good.
This has seldom been a problem since I'm queing all my report requests on a separate server, which feeds jsreport with jobs. Failed reports will eventually be rendered and the client probably won't notice the delay caused by the jsreport restart.
When jsreport is fed with very large reports (json dataset 20-40 MB) this gets troublesome.
This memory chart shows the memory consumption for tre consecutive large reports. The third report crashes my Fargate container.
I'm running the official 2.11 Docker image.
Strategy is "in-process".
The machine is a 2vCpu 5GB Fargate container.How should I investigate this further?
I'm assuming that this is some kind of out-of-memory crash, but I don't know since the crashed machine does lot leave any evidence after the crash.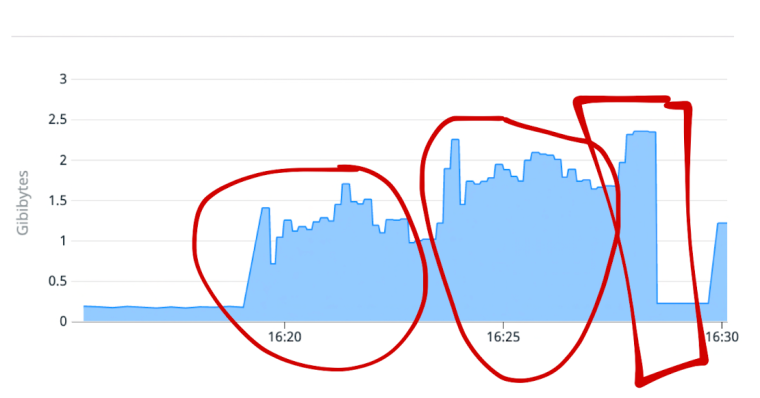
-
Please try to run locally an environment with one report. Then start rendering the report using a client of your choice in an endless loop. Keep this running for some hours and if the jsreport really OOMs afterward, we should be able to replicate the same and analyze it. If that will happen please share with us steps we can follow to reproduce.
We do the same during jsreport development, to verify we don't leak memory, but maybe your report is specific at some point.
-
I'll do that and get back to you. Thanks.
