Possible to use express or other means to marshal data from client to server via AJAX?
-
Thanks.
I have a complicated report layout using css grids. I need to be precise with my page breaks so I need to know the height on some specific divs before rendering.
I'm measuring the divs in a script, and my hope was that I could somehow communicate the measurements back to the server side before the second render pass. I tried to handle the page breaks directly in the script, but this quickly went into a mess as so many things break, for instance the page counter.
How about this:
- measure height in a script tag
- send the measurements from the scrip tag to an API endpoint and tag the data with a unique report id
- fetch the measurements from within afterRender and then start a second render pass
The API endpoint could be at my API server, or even at the jsreport server with an express server.
-
You have much easier options to pass information from template to script then to send data to an endpoint.
You can for exampleconsole.login the<script>and then reach and parse the message in theafterRenderreq.context.logs.
-
That's really great.
Thank you!I have had a hard time to debug my scripts. This way I can "forward" my console from the script so I can see them in the profiler. Is this a good solution for this, or is there an easier way to se logs from scripts?
-
Something is different between my environment (jsreport 4.7 Docker image) and the playground.
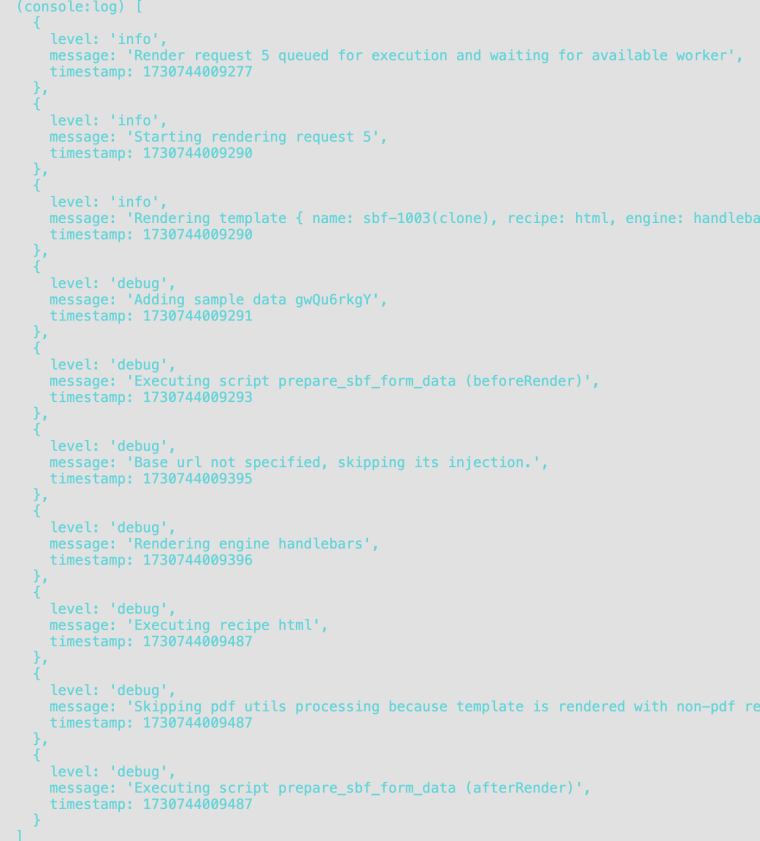
When I console.log in a script tag I cannot see this in req.context.logs. I have configured logging to console with level "debug". req.context.logs includes other info and debug logs, but not the one from by script tag.
Do I need to add some extension for this to work?
-
or is there an easier way to se logs from scripts?
Not sure I get it, but the
console.logcalls are visible in the profile tab. From the inline<script>as well as the helper call or jsreport script entity.Something is different between my environment (jsreport 4.7 Docker image) and the playground.
This works for me fine the same.
docker run -p 5488:5488 -e "chrome_launchOptions_args=--no-sandbox, --disable-dev-shm-usage, --disable-gpu" jsreport/jsreport:4.7.0template
<script>
    console.log('aaa')
</script>
script
async function afterRender (req, res) {
    console.log(req.context.logs)
}
output in profile
Object <[Object: null prototype] {}> {
    level: 'debug',
    message: '(console:log) aaa',
    timestamp: 1730739568385
  },
-
I get it to work with your
docker runcommand. But it does not work in my docker-compose environment. What could differ?My Dockerfile is quite minimalistic. I don't think the prolem is here:
FROM --platform=linux/arm64 jsreport/jsreport:4.7.0

COPY .npmrc /app/.npmrc
ARG NPM_TOKEN

RUN cd /app && npm install \
  handlebars-helpers \
  node-fetch \
  i18next \
  i18next-locize-backend \
  bwip-js \
  @plantrail/ddp

RUN cd /app && npm ls
My jsreport.config.json is quite old. Maybe something deprecated is in here?
{
  "encryption": {
    "secretKey": "secret"
  },
  "logger": {
    "console": { "transport": "console", "level": "debug" }
  },

  "workers": { "numberOfWorkers": 4 },
  "reportTimeout": 600000,
  "httpPort": 5488,
  "allowLocalFilesAccess": true,
  "store": {
    "provider": "fs"
  },
  "blobStorage": {
    "provider": "fs"
  },

  "extensions": {
    "chrome-pdf": {
      "strategy": "chrome-pool",
      "numberOfWorkers": 10
    },
    "express": {
      "inputRequestLimit": "100mb",
      "enabled": true
    },
    "child-templates": {
      "parallelLimit": 20
    },
    "fs-store": {
      "sync": {
        "usePolling": false
      }
    },
  }
}
This is the jsReport section from my docker-compose.yaml. I just added the chrome launch options, but it didn't work:
  jsreport4:
    build:
      context: ../services/jsreport4
      args:
        - NPM_TOKEN
    environment:
      - mode=development
      - chrome_launchOptions_args=--no-sandbox, --disable-dev-shm-usage, --disable-gpu
    expose:
      - '5488'
    ports:
      - '5487:5488'
    volumes:
      - ../services/jsreport4/mounted:/jsreport
The console.log can be seen in the chrome console:

sending req.context.logs to the console at the server in afterRender shows other logs, but not the log from my script tag.

-
Solved. I got it to work when I changed recipe to chrome-pdf.
Is this as it should, i.e. console.log at the client side only works for chrome-pdf?
-
jsreport doesn't eval html output of the html recipe. It wouldn't be reasonable.
-
New problem.
I'm collecting measurement data from my html elements, put them in an array and stringify before sending the data to the server side via console.log. It seems as if the message gets truncated. Is console.log not a reliable way to marshal data to the server?I get the feeling that the profile pane in jsReport truncates long strings, and the truncated string is also what is what I get in
req.context.logs[i].message.
-
Never mind.
I see that the message is truncated at 1000 characters. This is probably reasonable to not bloat the logs.I solved it by chunking my console.log calls instead.