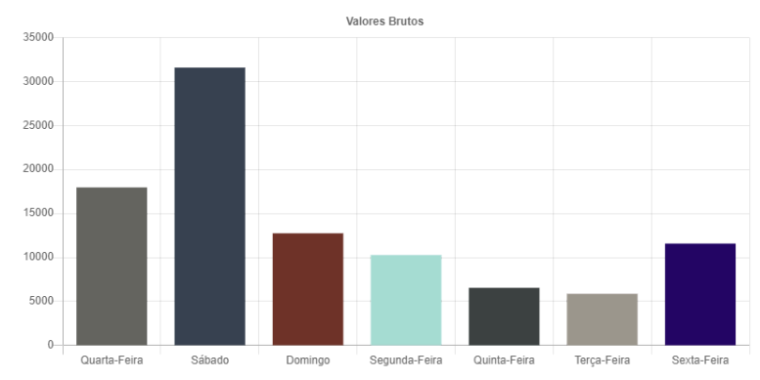
how do I convert pdf report chart to html-to-xlsx?
-

<!-- GRAPHICS-->{{if graphTotal}} <canvas id="graph" class={{toJSON graphTotal.graphClass}}{{/toJSON}} style="margin:auto;margin-top:45px;"></canvas> <script> var chart = "graph"; var ctx = document.getElementById(chart).getContext('2d'); var myChart = new Chart(ctx, { type: {{toJSON graphTotal.graphType}}{{/toJSON}}, data: {{toJSON graphTotal}}{{/toJSON}}, options: { elements: { line: { tension: 0, fill: false, } }, legend: { display: false, position: "bottom", }, title: { display: true, text: {{toJSON graphTotal.graphTitle}}{{/toJSON}} }, plugins: { datalabels: { display: {{if graphTotal.graphDatalabels == true}}"auto"{{else}}{{toJSON graphTotal.graphDatalabels}}{{/toJSON}}{{/if}}, color: "#fff", formatter: function(value, context) { return value + ' ' + {{toJSON graphTotal.graphSymbol}}{{/toJSON}}; } }, }, scales:{ xAxes: [{ display: {{toJSON graphTotal.displayX}}{{/toJSON}}, stacked: {{toJSON graphTotal.graphX}}{{/toJSON}}, scaleLabel: { display: {{toJSON graphTotal.scaleLabelDisplayX}}{{/toJSON}}, labelString: {{toJSON graphTotal.scaleLablelStringyX}}{{/toJSON}}, } }], yAxes: [{ display: {{toJSON graphTotal.displayY}}{{/toJSON}}, stacked: {{toJSON graphTotal.graphY}}{{/toJSON}}, ticks: { beginAtZero: {{toJSON graphTotal.beginAtZeroY}}{{/toJSON}} }, scaleLabel: { display: {{toJSON graphTotal.scaleLabelDisplayY}}{{/toJSON}}, labelString: {{toJSON graphTotal.scaleLablelStringyY}}{{/toJSON}}, } }] }, } }); </script> {{/if}}
-
This recipe cannot convert your
html/jschart into excel chart.However you can place your chart into the excel template and reference your future dynamic values
https://jsreport.net/learn/html-to-xlsx#insert-output-into-xlsx-template
https://playground.jsreport.net/w/admin/VvaGnaE_