Slow but constant memory leak with chrome-pdf recipe on Docker (jsreport 4.12.0)
-
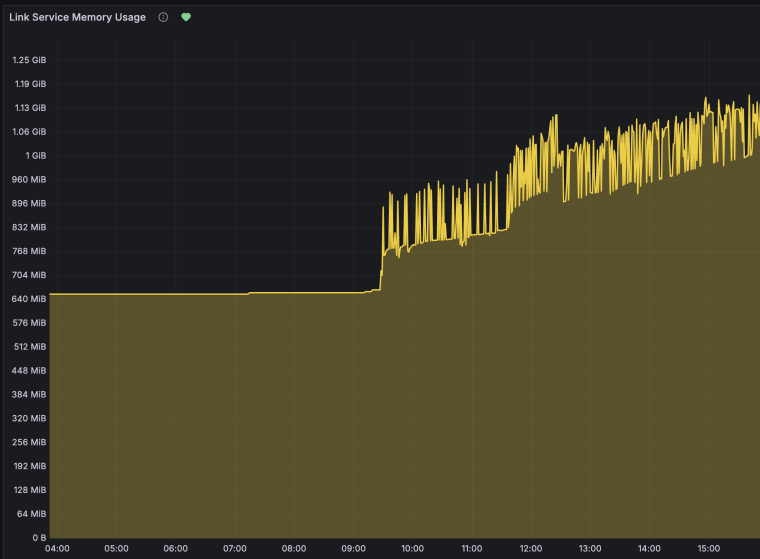
We are observing a slow but constant memory growth tested on jsreport 4.12.0 running in Docker when generating PDF reports via the chrome-pdf recipe. Memory increases linearly with the number of rendered reports and is never reclaimed, even after extended idle periods.
Environment:
jsreport 4.12.0 (official Docker image jsreport/jsreport:4.12.0)
Docker version 29.1.4-rd
Default configuration (no custom extensions, authentication disabled)
2 Chrome workers (default)Reproduction steps:
Start the official jsreport container:docker run -d --name jsreport-memtest -p 15488:5488 \ -e "extensions_authentication_enabled=false" \ jsreport/jsreport:4.12.0Check initial memory baseline:
docker stats jsreport-memtest --no-stream --format "{{.MemUsage}}"
# ~226 MiB
Send 500 PDF render requests (100 rounds × 5 parallel) using the script below:
# Save as memory-stress-test.sh
for i in $(seq 1 500); do
  curl -s -o /dev/null -X POST http://localhost:15488/api/report \
    -H "Content-Type: application/json" \
    -d '{
      "template": {
        "content": "<html><body><h1>Memory Test #'$i'</h1><table>'$(printf '<tr><td>Row %s</td><td>Value</td><td>Lorem ipsum dolor sit amet</td></tr>' $(seq 1 50))'</table></body></html>",
        "engine": "handlebars",
        "recipe": "chrome-pdf",
        "chrome": { "landscape": true, "format": "A4" }
      }
    }' &
  # Run 5 in parallel, then wait
  if (( i % 5 == 0 )); then
    wait
    sleep 0.5
  fi
done
wait
Check memory after 500 reports:
docker stats jsreport-memtest --no-stream --format "{{.MemUsage}}"
# ~1062 MiB
Wait 30 seconds (idle — no requests) and check again:
docker stats jsreport-memtest --no-stream --format "{{.MemUsage}}"
# ~1055 MiB — memory is NOT reclaimed
Send another 1000 PDF render requests (same script, seq 1 1000) and check:
docker stats jsreport-memtest --no-stream --format "{{.MemUsage}}"
# ~1110 MiB — another +56 MiB that is never reclaimed
Observed results:
Phase Reports rendered Mem start Mem end Delta Batch 1 500 226 MiB 1062 MiB +836 MiB 30s idle 0 1062 MiB 1055 MiB -7 MiB Batch 2 1000 1054 MiB 1110 MiB +56 MiB 30s idle 0 1110 MiB 1106 MiB -4 MiB Batch 3 2000 1102 MiB 1225 MiB +123 MiB The initial jump (~800 MiB) is mostly Chrome worker startup, which is expected. However, after stabilization, memory continues to grow at approximately +56 MiB per 1000 reports and is never garbage collected.
No zombie processes were found inside the container — this is not a process reaping issue.
Expected behavior:
After rendering is complete, memory should return close to the post-warmup baseline (~1000 MiB), not continue growing indefinitely.
Impact in production on our customer:
In long-running containers that process reports continuously (e.g. scheduled exports every few minutes), this leak accumulates over hours/days and eventually causes OOM kills restarting the Kubernetes pod
4 worker with dedicated-process strategy
-
This could mean that Chrome or Node.js is just lazy in releasing the memory.
The idle time doesn't necessarily mean the memory gets released.Try to run the container with limited memory. This should force the memory release.
docker run -d --name jsreport-memtest --memory=500m -p 15488:5488 \
  -e "extensions_authentication_enabled=false" \
  jsreport/jsreport:4.12.0
With the 500m memory limit, I can run 10 000 reports without OOM.