Ok. In that case, what is the purpose of this clustering config as described here? https://jsreport.net/learn/fs-store?version=2.11.0#running-in-cluster
Posts made by zhwatts
-
RE: Load balancing vs. JS Report out-of-the-box Clusteringposted in general forum
-
RE: Load balancing vs. JS Report out-of-the-box Clusteringposted in general forum
Hi Jan, your comments validate what I suspected. Yes, it’s a requirement to use the report extension, as the originally requesting IIS app is not permitted to handle the output PDFs, due to content sensitivity.
Is it recommended to use Nodes clustering option over using something like HA Proxy, as I described in my original post?
Is there a good guide/ outline on how to configure JS Report for clustering I can use as a reference?
Thanks for your help!
-
Load balancing vs. JS Report out-of-the-box Clusteringposted in general forum
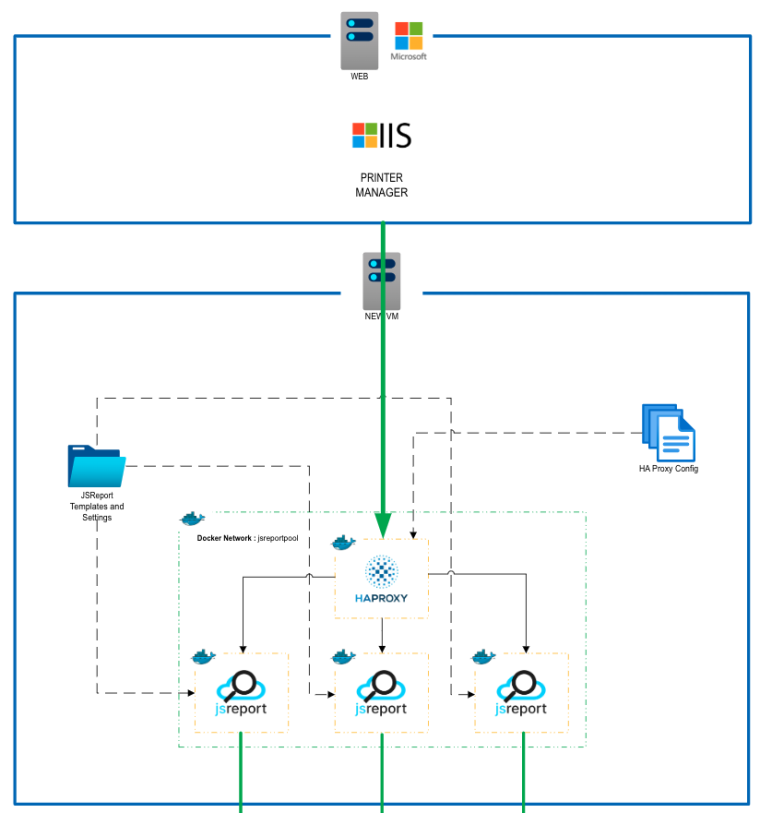
Hello, I am configuring JS Report for an app that has high capacity, high availability requirements. I'm currently investigating running multiple JS Report instances in a clustered configuration. I have designed a partially working PoC using HA Proxy, but am concerned it may be over-engineered, which lead me to investigate JS Report's ability to cluster natively.
I am following this documentation, but have a few questions.
Questions
- Is it fair to say that "JS Report Clustering" is really just Node's ability to cluster? eg this? Or is there some additional JS Report magic that happens?
- Does clustering support a single endpoint that my app can register jobs with, and communicate for job status updates, irrespective of which JS Report instance is tackling the render job?
- Based on jsreport docs, I trust that data consistency isn't a concern, however how can I overcome scenario where one instance of JS Report can respond to job status update request, if the job is being serviced by another JS report instance?
- I am planning to move to a MSSQL based template store. will this also persist all running job stats in MSSQL as well, or will that remain in the /tmp_deploy/reports file?
My Scenario
- I currently run a single instance of JS Report, as a windows-service, using file-system store configuration.
- My app communicates with JS Report via .NET sdk (via web API), and has JS Report save the rendered files to a network drive that is ultimately picked up by a polling service that sends the PDF files to a printer.
- My app will register a job with JS Report, then check back with JS Report on interval basis regarding current status of job. When done, app will release another job to JS Report.
- My app currently uses JS Report to render PDF documents, using the Chrome-PDF Recipe.
My Problem
- I'm required to render 5K+ documents a day, and my average render time per document is 8~10 seconds, which is not acceptable.
- I have identified several areas in my template that can be optimized (there are a few costly network calls that the template has to make eg, remote loading dynamic images)
- In addition to optimizing the templates as much as possible, I'd also like to load balance requests, to allow multithreading requests to JS Report.
My Load Balancing Strategy
Initially, i've designed and developed a POC that uses dockerized instance of HA Proxy, with 3+ instances of dockerized JS Report. Each dockerized instance is mapped to a common/shared directory for templates and jsreport.config file. In this case, my app sends all traffic to HA Proxy, which then round-robins the jobs a pool of JS Report servers. 2 Draw backs have arisen:
- due to round robin strategy, i'm not guaranteed that my app will be connected to the servicing JS Report instance for it's job status check (see My Scenario/#3 ).
- If JS Report is designed to support instance clustering, then the use of HA Proxy may be un needed overhead.
my PoC overview

-
RE: Extremely high memory usage causing workers to frequently crashposted in general forum
Thanks Jan,
- we've updated to 3.12, we were previously on 3.5
- we are deploying as windows service using the jsreport win-install method, per your docs
- Yes, we trigger rendering using the web API
We will continue to do some testing and let you know our findings.
-
Extremely high memory usage causing workers to frequently crashposted in general forum
Environment
- We are currently running JS Report on a Windows 2019 server, with 8GB memory.
- Node is allowed to use heap size up to 4GB.
- We are running JS report as a windows service.
- JS report is configured to use 4 service workers. We're using Node version 18.16.0.
- JS Report is the only service/program running on this VM, aside from Windows itself.
- We're on the latest version of JS Report.
Problem Scenario
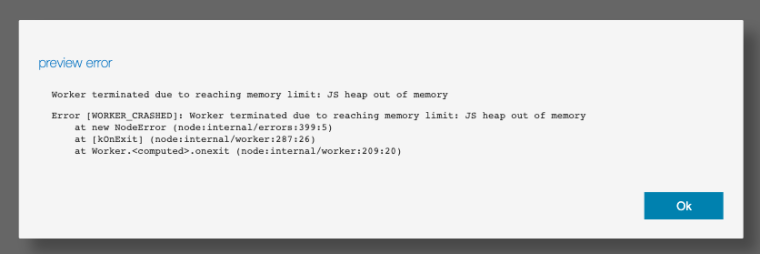
We are rendering anywhere from 1 to 500 Chrome-PDF based recipes one after the other, and are frequently experiencing instances where service workers crash due to being out of memory (see below message). When checking memory usage, the Node process used by JS Report is typically using 75% of the available memory, even when JS Report is not actively rendering.
A typically example of how our JS Report template is structured:
- A handlebars file is connected to one or more script files
- the script files source data by making calls to external API's, or the connect directly to an external database and make a SQL request
- we are not connecting to a data source aside from external API's or SQL requests
In trying to debug, we noticed there are a high number of Chrome.exe's running in the background, even when no reports are being generated. These chrome.exe's are accounting for the majority of memory usage by JS report. These Chrome.exe instances appear to spawn when a report is being actively generated, but they don't always terminate after the report finishes.
We've noticed that manually terminating those Chrome.exe instances does not reduce Node's memory usage, but when we restart the JS Report instance, Node Memory usage drops back down to acceptable levels.
Question
In what cases would JS Report leave Chrome.exe instances running after a report is finished? Any other type of suggestions to get useful debug info?
Example of high memory usage, even though there are no reports being generated

Example of report failure due to service worker crash

Example of numerous Chrome.exe instances running in background, even though no reports are currently being generated

-
Custom node flags when launching JSReport via windows serviceposted in general forum
Hello, I'd like to increase the available memory to the Node service used by JS-report. Typically, I'd do something like this
NODE_OPTIONS=--max-old-space-size=6096<< further validated via this link: Long ReportsIn my instance, I am running JS Report on Windows, and have the JS-Report Windows service installed. What's the best practice recommendation for getting the Windows Service to start with the custom
NODE_OPTIONSflag?I'm experimenting with something like this:
sc config jsreport-server binPath= "<path_to_node_executable> <path_to_jsreport_script> <custom_flags>"