Bad request
-
No luck with "http-server" strategy.
I also removed the "chrome-pdf" extension config where I had a chrome-pool with 3 workers. Still crashes
-
I have now ran the exact same report on my dev machine in debug mode. As the report works fine locally I could see what happened right after the crash in the log.
Log on prod server: crashes at line X (in debug log)
Log on dev server: don't crash. Line X+1 in the debug log says a child report is called.I suspected this child report as the villain, so I remarked it.
Unfortunately the server crashes at the exact same place again.I looked at the CPU and memory metrics at AWS. None of them peaks alarmingly. The prod machine has 1vCPU and 2GB of memory.
-
I receive the rendered reports via a node stream. Normally, if anything goes wrong i can catch this in
on('error', (e) =>...
But this error "Bad request" just silently breaks the server. I can't even notice it via a broken stream.
-
I'm very sorry. The "Bad request" error mentioned is our regression issue in 2.6.0 occurring just for http-server strategy when the worker process is recycled because of some error or timeout. All the consequent requests are then failing with "Bad Request". This error was introduced during some security improvements we made in 2.6.0. The fix is ready and we should push it to the 2.6.1 hotfix in the next days.
The current workaround is to use a different strategy
dedicated-process,in-processor downgrade to the 2.6.0.
-
I've tried all three server strategies. Getting the same behaviour on
in-processanddedicated-process(this is the default, isn't it?)Or.. could it be that I still haven't managed to get jsreport to read my config file??
I'll try this as you suggested earlier, by supplying a faulty config file to see if the server reacts to this.
-
I can now confirm that my config file is read in my jsreport container at Fargate:

I can also confirm that the "bad request" problem exists also with
"strategy"="in-process".
-
Error: Bad request at IncomingMessage. (/app/node_modules/script-manager/lib/worker-servers.js:228:25)
That can't be true. The stack trace shows the
http-processstrategy.Error: Bad request at IncomingMessage. (/app/node_modules/script-manager/lib/worker-servers.js:228:25)Do you see this in the output logs?
info: Setting in-process strategy for renderingIf yes, then you are really using the in-process strategy and the "Bad request" error needs to have at least a different stack.
If no, you are setting something wrong in the config or pass environment variables that overwrites the config values.
The config should have"templatingEngines": { "strategy": "in-process" }
-
You're right. I see
Setting http-server strategy for renderingin the log when jsreport starts.My config looks like this:
{
  "httpPort": 5488,
  "allowLocalFilesAccess": true,
  "store": {
    "provider": "fs"
  },
  "blobStorage": {
    "provider": "fs"
  },
  "templatingEngines": {
    "numberOfWorkers": 2,
    "timeout": 300000,
    "strategy": "in-process"
  },
  "chrome": {
    "timeout": 300000
  },
  "extensions": {
    "scripts": {"timeout": 300000},
    "chrome-pdf": {
      "strategy": "chrome-pool",
      "numberOfWorkers": 3
    },
    "express": {
      "inputRequestLimit": "50mb"
    },
    "child-templates": {
      "parallelLimit": 5
    }
  }
}
Can you spot any error?
I tried to deliberately corrupt the config file to ensure that it's actually loaded. When I do this, the server complains about a bad config file and does not start.Can these settings be set anywhere else and override the config file?
-
I read the startup log a bit more thorough.
What does "/app/data/data: File exists" mean? I don't think I have copied anything to that folder.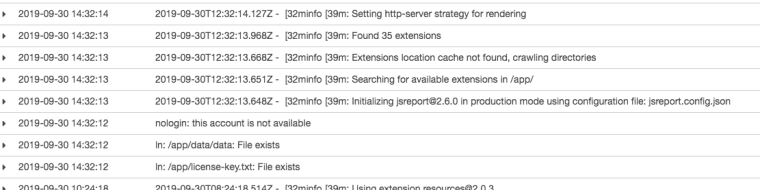
Here is my Dockerfile
FROM jsreport/jsreport:2.6.0

COPY license-key.txt /app
COPY ./mounted/jsreport.config.json /app
COPY ./mounted/data /app/data

RUN cd /app && npm install \
  moment \
  moment-timezone \
  intl \
  dd-trace \
  handlebars-helpers \
  node-fetch \
  jsreport-assets \
  jsreport-static-pdf
-
I suppose that ENV-params have higher priority than the config-file?
In that case I think it's impossible to change strategy with your official docker image. I found this in your Dockerfile:ENV templatingEngines:strategy http-server
-
Hm. Ok. I forgot about that. I am very sorry. This is badly set a default value.
You need to add this to your dockerfile
ENV templatingEngines:strategy in-processWe will think through how to fix this.
-
I link here github issue where this will be solved
https://github.com/jsreport/jsreport/issues/643I apologize again for your troubles.
-
Ok, I'll set it in my Dockerfile.
I'm getting odd results when I build my production image. In order to be able to run jsreport on Fargate I need to copy all templates into the image at build time. But as soon as I do this the container no longer maps my local volume. I'll try to explain:
Scenario 1:
- Build image without copying templates to /app/data
- Start local docker image with docker-compose and map local volume to /jsreport
- All changes I do in Studio is now persisted in my local folder which I can version control
Scenario 2:
- Build an image and copy templates (
COPY ./mounted/data /app/datain Dockerfile) - Push to production at AWS
- jsreport server at AWS now has my templates embedded
- Start local container via docker-compose (exactly as in scenario 1)
- Changes i Studio is not persisted in my local folder
How are we supposed to use this concept? I can see in the official docker image that these two scenarios are taken care of, i.e. you check is /jsreport is mounted and in that case link /app/data to this local folder. But I'm not sure that it works as intended.
In particular, I'm wondering why you have
VOLUME ["/jsreport"]in your Dockerfile. Wouldn't this direct the ln commands to the internal /app/data instead of the locally mounted folder? I'm not very knowledgable in Docker, so this "hunch" might be completely wrong.
-
After switching to "in-process" my heavy report works without error. I think it's more to the problem than just bad error reporting. The "Bad request" came after about 4 seconds. Efter switching to in-process the report is rendered in just over a minute.
I do wonder if in-process rendering makes the server more sensitive to overload? After switching to in-process and deliberately overloaded jsreport (10 heavy reports in parallell) the server crashed. I haven't made a side by side comparison, byt my feeling is that before switching to in-process, jsreport could manage more reports in parallell. They took a long time to render, but it didn't crash.
I have now adjusted my queue-handling so I have a separate queue for heavy reports. This queue only puts through one report concurrently. Is this how I have to solve this? I thought that jsreport could handle parallel requests.
-
in-process runs js evaluation inside the main process. This means that running many of the requests with heavy memory consumption in parallel can cause OOM.
You should use a properly configured web server in front jsreport, or increase node process memory limits in such case.
-
Thanks, I'll increase max-old-memory. What do you mean by having a web server in front of jsreport? My jsreport is not available from the outside. All requests comes from another server which serves/distributes my queue jobs. One queue is for report rendering. Why would I need a web server in front of jsreport?
-
No, in this case you are able to handle the traffic on your client-side where you distribute queue jobs.
