JSREPORT BROWSER CLIENT CDN
-
In using the browser cdn client I noticed that I could not open the rendered pdf in another window using the window.open(renderedpdf) (I was using the blob constructor to do this)
 jsreport.serverUrl = "https://hostserver.net/"
        jsreport.headers['Authorization'] = "Basic " + btoa("email@gmail.com:password")

        console.log(jsreport.serverUrl )
        const report = await jsreport.render({
            template: {
                name: 'stockrecon'
            },
            data: {
            someData: data
            }
        });

const pdfBlob = new Blob([ report.content], { type: 'application/pdf' });
            const pdfUrl = URL.createObjectURL(pdfBlob);
            window.open(pdfUrl, "_blank");
. I could however download the pdf using report.download('renderedpdf.pdf'). Please can I get any help in this regard?
-
What version of the browser client do you use?
What do you see in the F12 console errors/warns?
-

-
browser client cdn
<script src="https://unpkg.com/@jsreport/browser-client/dist/jsreport.umd.js"></script>
-
You need to change
const pdfBlob = new Blob([ report.content], { type: 'application/pdf' });to
const pdfBlob = await report.response.blob()However, you can minimize code to just
report.openInWindow({ title: 'myreport' })
-
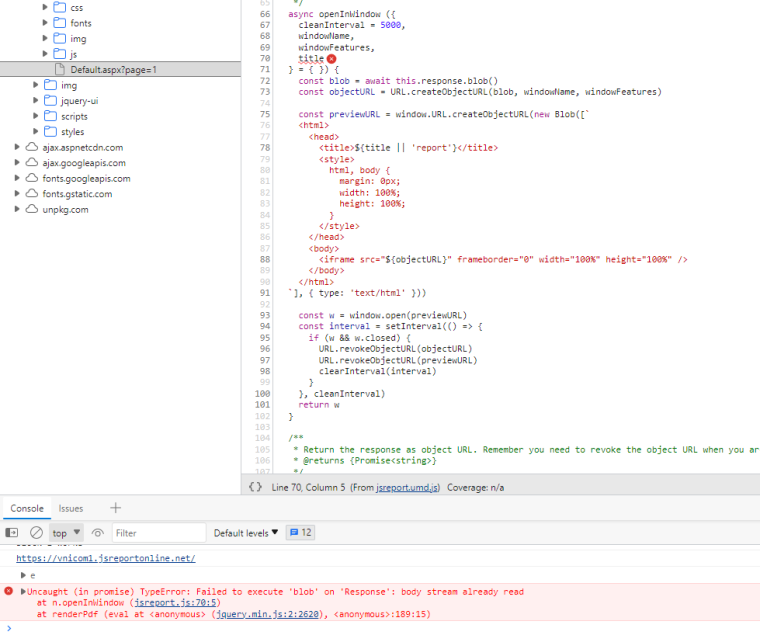
The open window is not working only download is working
-
Issue resolved thanks so much . I was downloading as well as opening new window to render . Apparently you can only do one
-
@Sesughter01 hmm makes sense to support both, i have opened new issue to support it. thanks.
-
New Problem being experienced .
- F12 result in console.log(data)
{
.....
someData: data
}

- F12 result in console.log(data)
-
- Rendered result from
report.openInWindow({ title: 'Stock Register' })
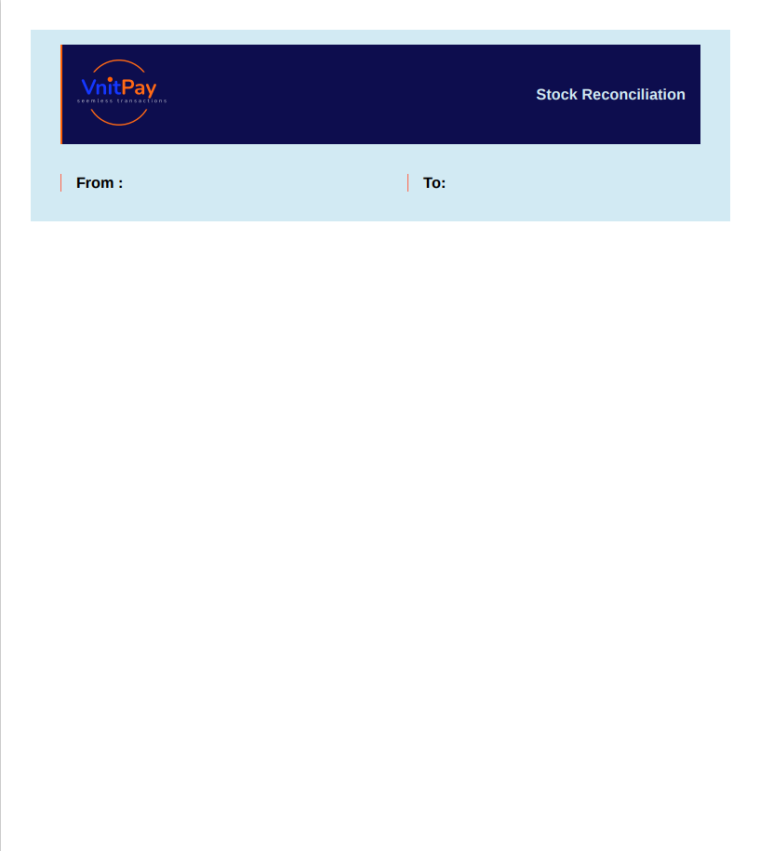
- Rendered result from
-
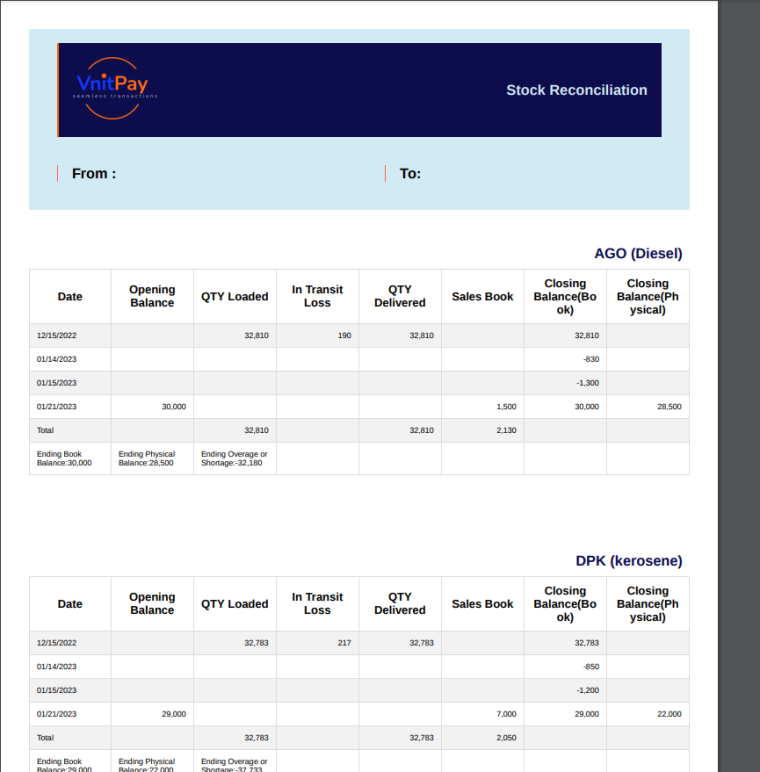
- Rendered results from jsreport online
-
The report doesn't seem to have filled input data.
Something is wrong with your report template or provided data I guess.You can try to open the profiler in the jsreport studio and switch to "Full profiling".
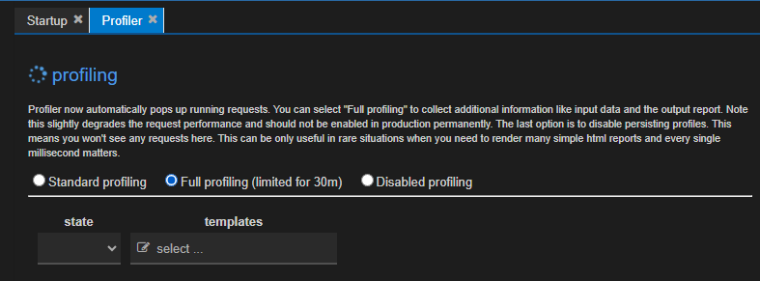
Then you can profile the running report and check what data are actually coming to the report.Please refer to the documentation here
https://jsreport.net/learn/studio
-
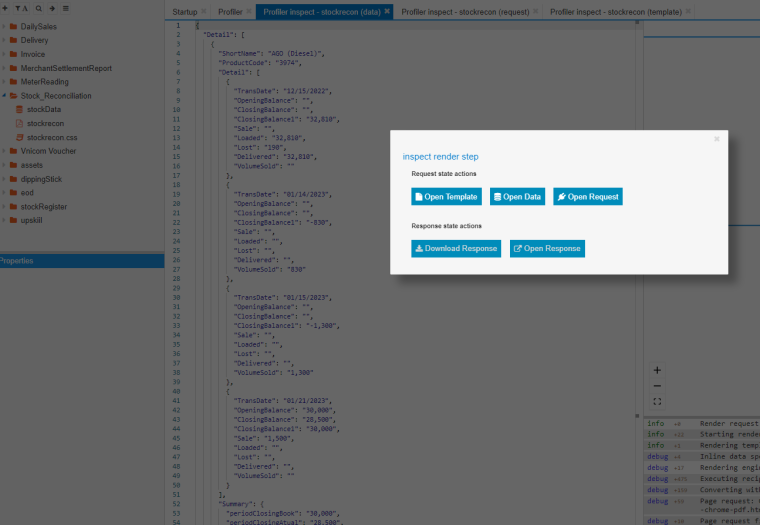
this is the request data input from the online instance of the jsreport . This from running the report online but how do I see data from the external calls?
-
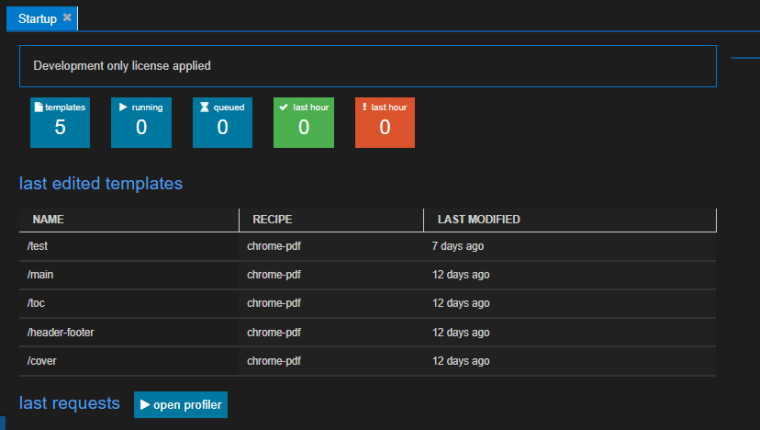
The profiler feature for checking running remote requests can be opened from the startup page using "open profiler" button.
-
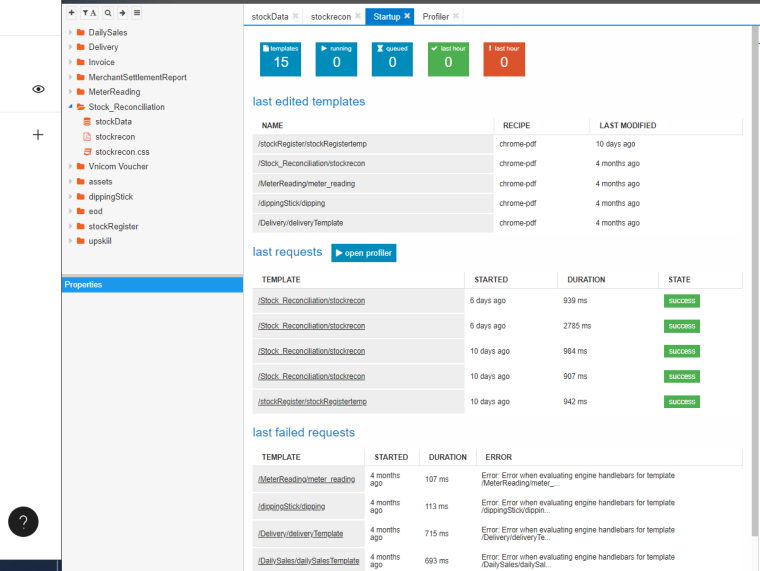
From what appears here on my startup page it means all the calls to my template stockrecon have not been received because I made a call to this jsreport.serverUrl = "https://vnicom1.jsreportonline.net/" today
-
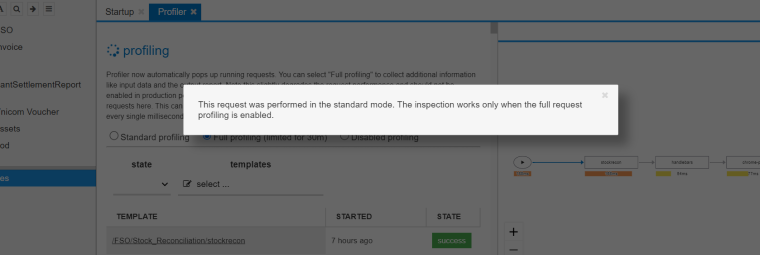
ok so apparently I had to change my login details to another account belonging to our team. However now I can't view the request data it brings up the error message when I try.
-
Yes, you need to do what it says. Close the dialog, switch to the "Full profiling" and wait for the incoming request to pop up.

