Memory Usage
-
Hi, I have an application pod containing the Jsreport service (in GCP) and I am using it to generate reports through my platform. For a long time now, I have been experiencing constant pod restarts due to lack of memory. In my production environment, I have version 3.8, but in my test environment, I already have version 4.3.1 and I continue to have the same behavior. Whenever I generate a report, the memory usage increases and never goes back down.
What can I do? I need help because it is becoming unfeasible to have the pod constantly restarting.
-
We aren't aware of memory leaks in the recent version. You will need to isolate the problem.
Try to run the same report, locally, in a loop one by one, and with limited memory.
You can limit the memory when running docker or when running plain nodejs with max-old-space-size flag.
Does such a test fail on OOM?
If yes, please share with us the config and workspace so we can replicate the issue.
-
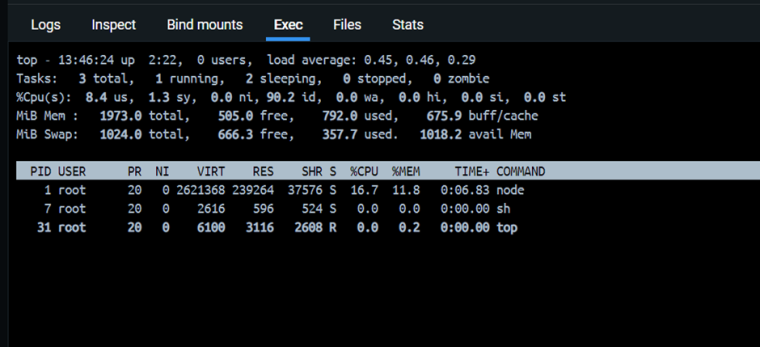
This is my case, when I start a pod with jsreport I have these statistics. Here I have 505 MB of free memory
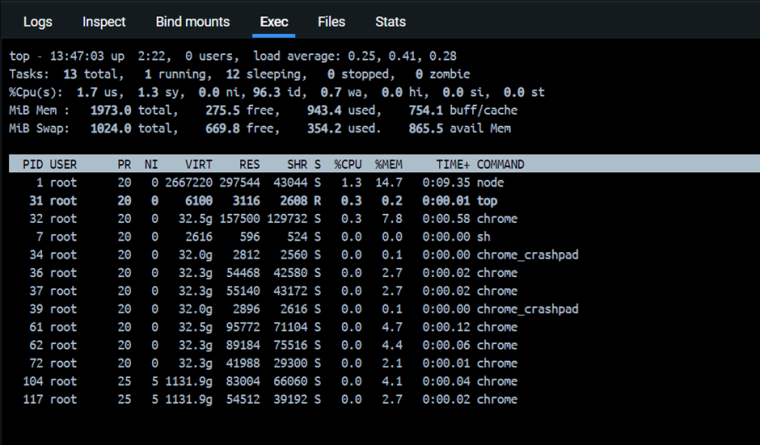
After running the first report (I use the invoice pdf https://playground.jsreport.net/w/admin/hBfqC7af). My free memory decreases as shown in a message:
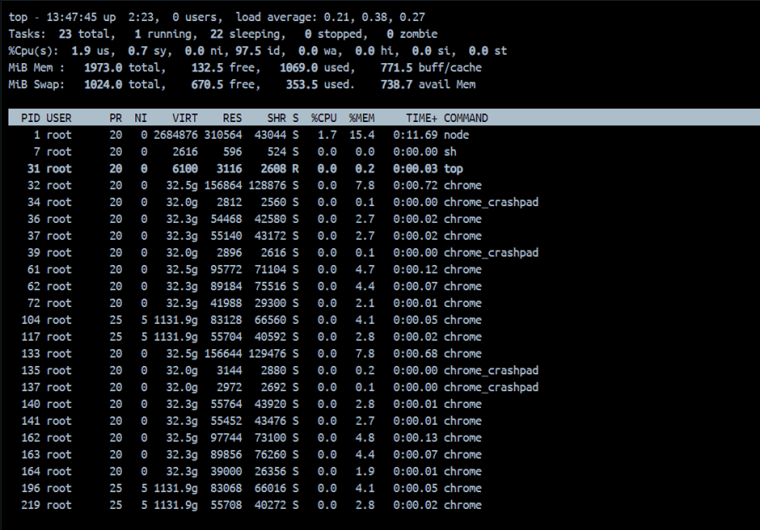
The memory after sending the same report (second time):
After 15 minutes of rendering the report, I have this result:
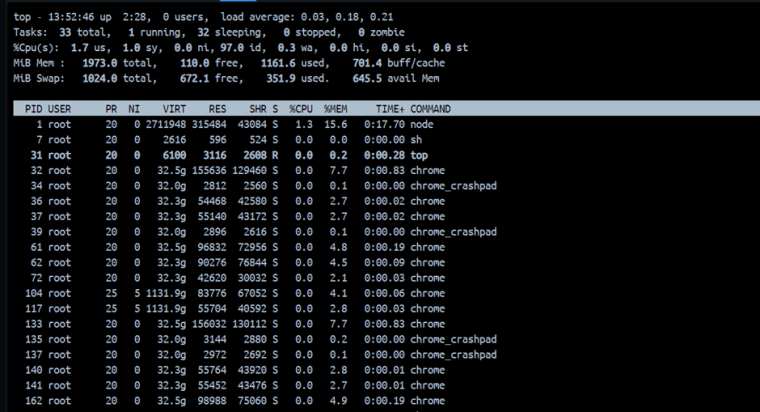
The chrome command is never cleared. All my reports use Chrome PDF.
-
I haven't had time to investigate this, but I actually have been seeing more server crashes due to low memory lately. I'm rendering some huge reports, so I thought I had some bugs or something. I'll be following this thread if anything comes up that I should test.
Last week my JSReport 4.3 docker container at Fargate restarted two times due to low memory, which is quite rare.
-
jsreport by default reuses chrome instances
https://jsreport.net/learn/chrome-pdf#chrome-process-allocationThe nodejs is garbage collected runtime. It will clear the memory when it "gets the mood".
To test the memory leaking, give the pod or container limited memory like I recommended, and then test in the loop.I've tried now the leak test and I don't see it would be getting out of bounds.
Start jsreport with just 300mb
docker run -p 5488:5488 -d -m=300m jsreport/jsreport:4.4.0Then render 10 000 pdfs => no OOM.
I'm not saying there is no memory leak, but we will need to deterministically replicate it to be able to localize it.const client = require('@jsreport/nodejs-client')('http://localhost:5488') async function runOne () { const r = await client.render({ template: { name: 'invoice-main' }, data: { "number": "123", "seller": { "name": "Next Step Webs, Inc.", "road": "12345 Sunny Road", "country": "Sunnyville, TX 12345" }, "buyer": { "name": "Acme Corp.", "road": "16 Johnson Road", "country": "Paris, France 8060" }, "items": [{ "name": "Website design", "price": 300 }] } }) return r.body() } async function runMany() { for (let i = 0; i < 2000; i++) { console.log(i * 5) await Promise.allSettled([runOne(),runOne(),runOne(),runOne(),runOne()]) } } runMany().then(() => console.log('done')).catch(console.error)